

Financial Modelling Glossary: 25 Terms Every Beginner Should Know
If you’ve ever opened a financial model and felt like you’d walked into the middle of a conversation, you’re not alone. People throw around words like driver, circularity, and FCFF as if everyone already knows them. Most of us learned them the slow way, usually by getting something wrong first.
This financial modelling glossary aims to shorten that process. It covers 25 financial modelling terms for beginners, arranged in the order you’ll meet them while building a model. We start with the building blocks, move through forecasting and testing, then cover valuation, and finish with returns and checks. Each entry gives a plain-English definition and a rupee example you can picture.
Model building blocks
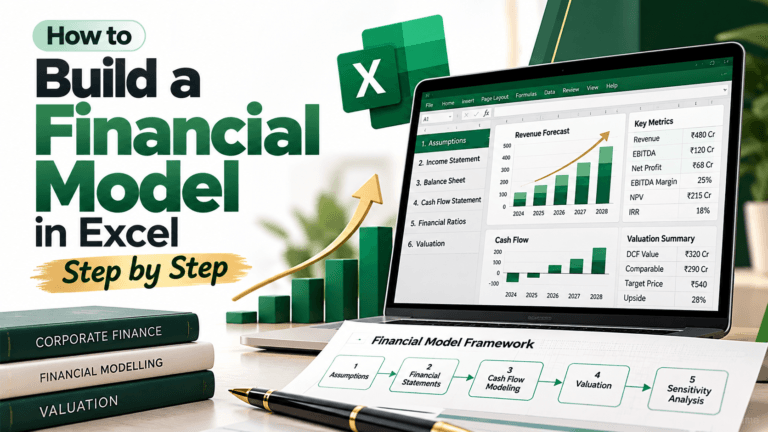
Financial model
A financial model is a spreadsheet or software tool that uses formulas to represent a business, project, or investment. You enter assumptions, the model does the arithmetic, and you can see what happens to profit, cash, and value when something changes. Say a café needs ₹50 lakh to open. A model can estimate monthly sales, rent, and staff costs, then show the month the cash runs out. All of that comes from a handful of inputs.
Assumptions
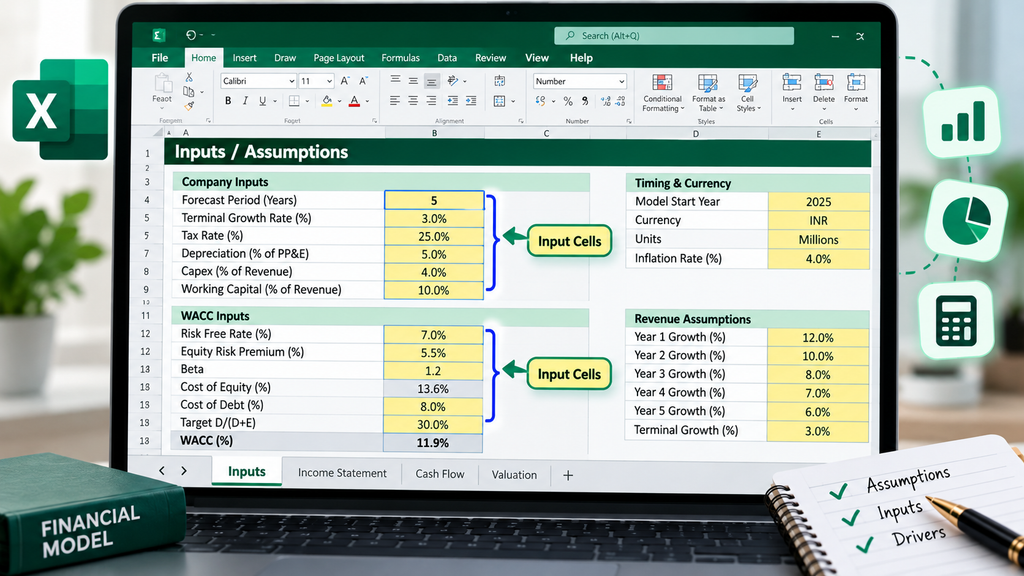
Assumptions are the numbers you choose: sales growth, gross margin (the share of revenue left after direct costs), the tax rate, or the price of a new machine. Keep them in one clearly labelled place, apart from the calculations. That way anyone can change an assumption and see the effect straight away. If sales are expected to grow 12% a year, that 12% should sit in an input cell, not buried inside a formula.
Income statement
The income statement, also called the profit and loss statement or P&L, shows revenue, costs, and profit over a period. It starts with sales and works down to net profit. Suppose a business earns ₹10 crore in revenue and spends ₹7.5 crore on operating costs, interest, and tax combined. Its net profit for the period is ₹2.5 crore.
Balance sheet
The balance sheet is a snapshot taken at one moment. It lists what the business owns (assets), what it owes (liabilities), and the owners’ stake (equity). The two sides must match, so assets always equal liabilities plus equity. A business with ₹40 lakh of assets, funded by ₹25 lakh of loans and ₹15 lakh of owners’ money, balances exactly.
Cash flow statement
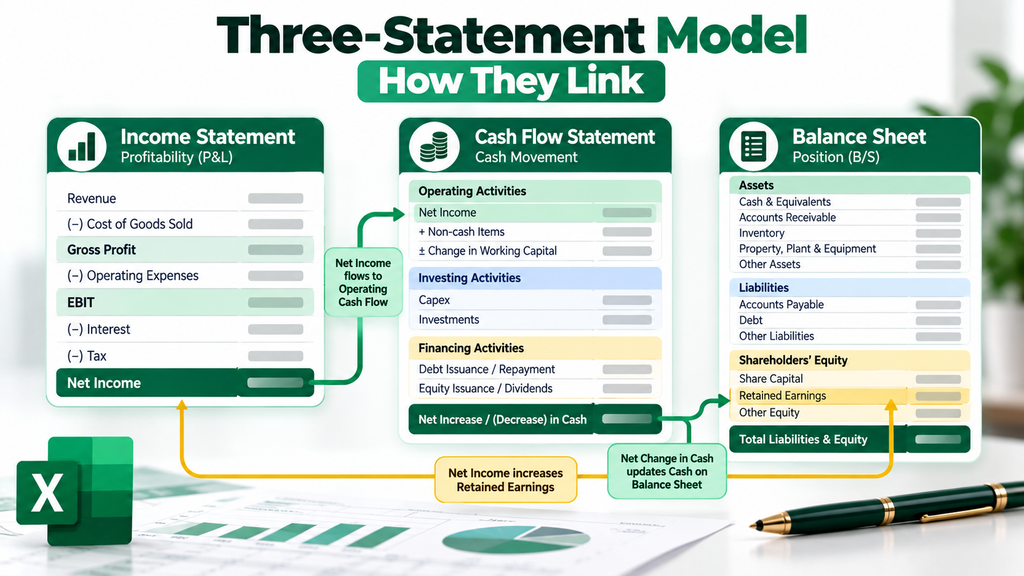
The cash flow statement follows the actual movement of cash over a period, split into operating, investing, and financing activities. This is where beginners often get caught out, because profit and cash aren’t the same thing. A sale on credit counts as profit straight away, but no cash arrives until the customer pays. A business might book ₹5 lakh of credit sales in a month, report a healthy profit, and still see its bank balance barely move. In a three-statement model, the three statements link together, so a change in one flows into the others.
Forecasting terms
Driver
A driver is the variable a forecast line depends on. Revenue is often driven by customers multiplied by average price, and a cost might be driven by a percentage of sales. A good driver is one you can explain and estimate. Take a training institute with 400 students paying ₹60,000 each. Its fee income is ₹2.4 crore. Change the student count, and the forecast updates on its own.
Working capital
Working capital is the cash tied up in day-to-day operations. It includes receivables (money customers owe you), inventory (stock on the shelf), and payables (money you owe suppliers). Net working capital is roughly receivables plus inventory minus payables. Models usually forecast it in days. Say annual sales are ₹3.65 crore and customers take 60 days to pay. About ₹60 lakh is then sitting in receivables. A business can be profitable and still run short of cash, because growing working capital keeps soaking up money.
Capital expenditure (capex)
Capital expenditure, or capex, is spending on long-lived assets such as machinery, buildings, computers, or software. It doesn’t hit the profit statement in one go. Instead, it’s spread over the asset’s life as depreciation. Take a ₹12 lakh machine with a six-year life. Using straight-line depreciation, the simplest method, you’d record ₹2 lakh of depreciation each year.
Depreciation and amortisation (D&A)
Depreciation spreads the cost of a physical asset over its useful life. Amortisation does the same for intangible assets, such as software licences or patents. Both reduce reported profit, but neither takes cash out of the business in that year. Back to the machine: its ₹2 lakh of annual depreciation lowers reported profit, yet the cash left the business the day it was bought.
EBITDA
EBITDA stands for earnings before interest, tax, depreciation, and amortisation. It gives a rough picture of operating profit, before financing decisions, tax, and accounting charges for past investments. Analysts use it all the time. It ignores capex and working capital, though, so it can make a business look like it generates more cash than it really does. Take a company with ₹10 crore of revenue and ₹6.5 crore of operating costs before depreciation. Its EBITDA is ₹3.5 crore.
Testing and checking your model
Scenario analysis
Scenario analysis runs the model under sets of assumptions that belong together, such as a base case, an upside case, and a downside case. Each scenario changes several inputs at once, because in real life they tend to move together. A downside case might pair slower sales growth with thinner margins and customers who pay later. Seeing all three outcomes side by side tells you more than any single forecast can.
Sensitivity analysis
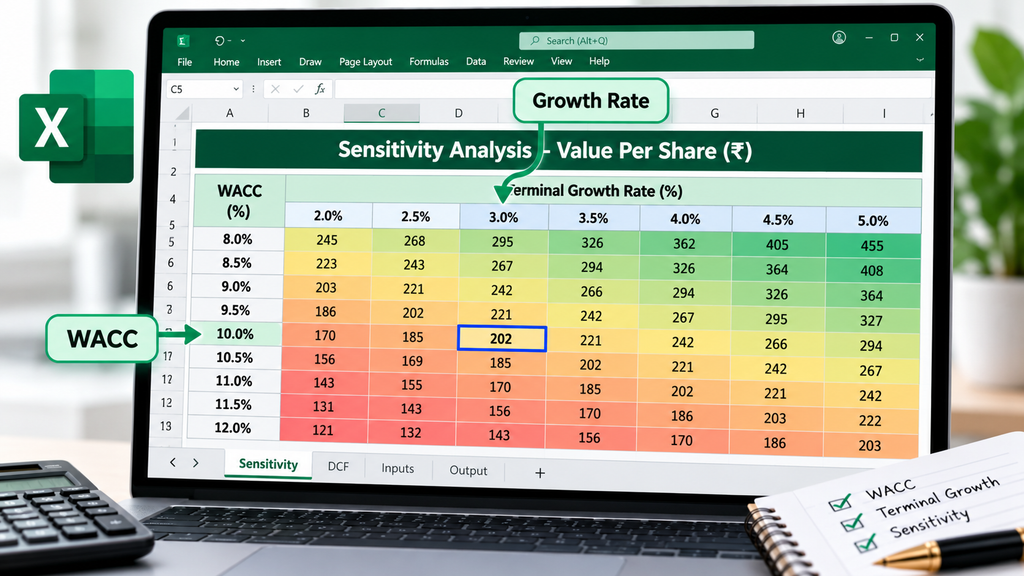
Sensitivity analysis changes one input, or sometimes two, and measures how far the result moves. That tells you which assumptions matter most. In [our DCF valuation guide], raising WACC by one percentage point cut the value per share by about 15%. In Excel, a sensitivity table is usually built with the Data Table tool, found under What-If Analysis on the Data tab.
Break-even analysis
Break-even analysis finds the sales level, or number of units, where profit is exactly zero and revenue just covers costs. The usual calculation divides fixed costs by the contribution per unit, which is the selling price minus the variable cost of each unit. Suppose fixed costs are ₹6 lakh a month and each unit contributes ₹300 after variable costs. The business breaks even at 2,000 units a month.
Circular reference
A circular reference happens when a formula depends, directly or indirectly, on its own result. A common case is interest calculated on average debt. The debt balance depends on cash flow, and cash flow depends on the interest. Circularity can make a model unstable or quietly produce wrong numbers. Many modellers add a circuit breaker, a switch that cuts the loop so the model can recover when an error sneaks in. Circular references are a bit like a hall of mirrors. Everything looks connected, and it’s hard to see where it starts.
Hardcode
A hardcode is a number typed directly into a calculation, rather than linked to an input or formula. Suppose a tax formula has 0.25 typed in, instead of a link to the tax rate cell. It will keep showing 25% even after someone changes the assumption. Hardcodes are easy to miss, which is why they cause so many model errors. Checking for them is a normal part of reviewing any model.
Valuation terms
Free cash flow to the firm (FCFF)
FCFF is the cash a business produces from operations after paying for the investments it needs. It’s measured before any payments to lenders or shareholders, and it’s usually the cash flow a DCF discounts. A common formula is EBIT × (1 − tax rate) + D&A − capex − increase in working capital. EBIT means earnings before interest and tax. Say EBIT is ₹4 crore, the tax rate is 25%, D&A is ₹1 crore, capex is ₹1.5 crore, and working capital rises by ₹0.5 crore. FCFF comes to 3 + 1 − 1.5 − 0.5 = ₹2 crore.
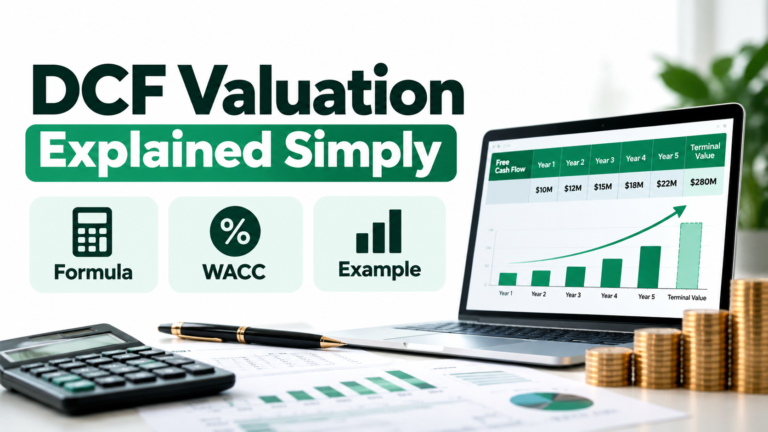
WACC, or weighted average cost of capital, is the blended return a company has to offer its shareholders and lenders. It’s the discount rate in most DCF models. Debt is usually cheaper than equity, and interest is tax-deductible, so the blend depends on how the business is funded. In the example from [our DCF valuation guide], a 75% equity and 25% debt mix produced a WACC of about 12%.
WACC
Discounted cash flow (DCF)
DCF valuation forecasts future free cash flows and discounts each one back to today at a required rate of return. The total is what the business is worth on that basis. The logic rests on time value of money: a rupee received later is worth less than a rupee in hand today. So ₹100 crore arriving a year from now, discounted at 12%, is worth about ₹89.29 crore today.
Terminal value
Terminal value estimates the value of every cash flow after the explicit forecast period, which usually runs 5 to 10 years. It often makes up a large share of the total, so its assumptions need careful checking. Take a business with ₹140 crore of FCFF in year 5, growing 5% a year after that, and a 12% discount rate. Its terminal value at the end of year 5 is about ₹2,100 crore.
Enterprise value
Enterprise value is the value of the whole business, regardless of how it’s funded. To get to equity value, the part that belongs to shareholders, you subtract net debt, which is total debt minus cash. A company with an enterprise value of ₹1,616 crore and net debt of ₹250 crore has an equity value of ₹1,366 crore.
Returns, multiples, and checks
Net present value (NPV)
NPV is the present value of a project’s future cash flows, minus its upfront cost. If the result is positive at your required return, the project should add value. Imagine a ₹10 lakh machine that generates ₹4.5 lakh a year for three years. Discounted at 10%, those inflows are worth about ₹11.2 lakh today, so the NPV is about ₹1.2 lakh.
Internal rate of return (IRR)
IRR is the discount rate that makes a project’s NPV equal zero. In effect, it’s the project’s annual return. You compare it with your hurdle rate, the minimum return you’d accept. For the machine above, the IRR is roughly 16.7%, comfortably above a 10% hurdle rate. Excel’s IRR function calculates it from a row of cash flows.
Payback period
Payback period is how long cumulative cash flows take to recover the initial investment. It’s simple to explain and handy as a quick risk check. The catch is that it ignores anything after the payback date, and it doesn’t adjust for time value of money. The ₹10 lakh machine pays back in about 2.2 years.
EV/EBITDA multiple
An EV/EBITDA multiple divides enterprise value by EBITDA. That lets you compare companies of different sizes and funding structures, which is why analysts reach for it so often in relative valuation. A company with an enterprise value of ₹1,616 crore and EBITDA of ₹160 crore trades at about 10 times EBITDA.
Balance check
A balance check confirms that the balance sheet balances. Total assets minus liabilities and equity should equal zero in every forecast year. If it doesn’t, something is broken, usually a missing link or a hardcoded number. My advice is to build this check in early and look at it after every change. If year 2 shows a ₹3 lakh gap, you know there’s an error before you trust any output.
Quick reference: All 25 terms
| Term | What it means in one line |
| 1) Financial model | A spreadsheet that links assumptions to financial outcomes |
| 2) Assumptions | The inputs you set, such as growth rate or tax rate |
| 3) Income statement | Shows revenue, costs, and profit over a period |
| 4) Balance sheet | A snapshot of assets, liabilities, and equity |
| 5) Cash flow statement | Tracks the actual movement of cash in a period |
| 6) Driver | The variable a forecast line depends on |
| 7) Working capital | Cash tied up in receivables, inventory, and payables |
| 8) Capex | Spending on long-lived assets |
| 9) D&A | Spreads the cost of assets over time without using cash that year |
| 10) EBITDA | Operating profit before interest, tax, depreciation, and amortisation |
| 11) Scenario analysis | Tests coherent sets of assumptions together |
| 12) Sensitivity analysis | Measures how much the result moves when one input changes |
| 13) Break-even analysis | The sales level where profit is zero |
| 14) Circular reference | A formula that depends on its own result |
| 15) Hardcode | A typed-in number that should be a link or formula |
| 16) FCFF | Operating cash after investment, before payments to lenders |
| 17) WACC | The blended required return on debt and equity |
| 18) DCF | Valuation by discounting future cash flows to today |
| 19) Terminal value | The value of cash flows beyond the forecast period |
| 20) Enterprise value | The value of the whole business before net debt |
| 21) NPV | Present value of cash flows minus the upfront cost |
| 22) IRR | The discount rate at which NPV equals zero |
| 23) Payback period | Time taken to recover the initial investment |
| 24) EV/EBITDA | Enterprise value divided by EBITDA |
| 25) Balance check | Confirms that assets equal liabilities plus equity |
Frequently asked questions ?
Where should a beginner start with financial modelling?
Start with the three statements and how they connect. Then build a simple DCF for a company you already know. Memorising definitions helps less than seeing the terms working inside a spreadsheet.
Do I need accounting knowledge before learning financial modelling?
Basic accounting helps a lot. Once you understand how profit, the balance sheet, and cash flow connect, your models become far more reliable. You don’t need to become an accountant first.
What is the difference between financial modeling and a budget?
A budget sets spending targets for a period. A financial model connects assumptions to outcomes, so you can test what happens if sales grow faster or borrowing costs rise.
Is Excel enough for financial modelling?
For most beginner roles and many professional ones, yes. Python and specialised software become worth learning when datasets get large or models need to run automatically.
What’s the most common mistake in financial models?
Hardcoded numbers and formulas that break the pattern across a row are among the most frequent errors. A balance check and a clearly separated assumptions sheet catch many of them.
Take the next step with Arivu Skills
Definitions get you started, but terms stick once you use them. If you’re thinking about a career that involves building and reading models, look at Arivu Skills‘ [Data Analytics programme] and [Business Analytics programme], or our [B.Com in Financial Analytics], offered with partner colleges. Our counsellors in Bengaluru, Chennai, and Coimbatore can help you work out which path suits you.
Start with three terms
Pick three terms from this list and find them in a spreadsheet you already use, or in a model a colleague or teacher has shared. Seeing a term in real numbers makes it stick faster than rereading the definition.
This glossary is for education only and isn’t financial advice.