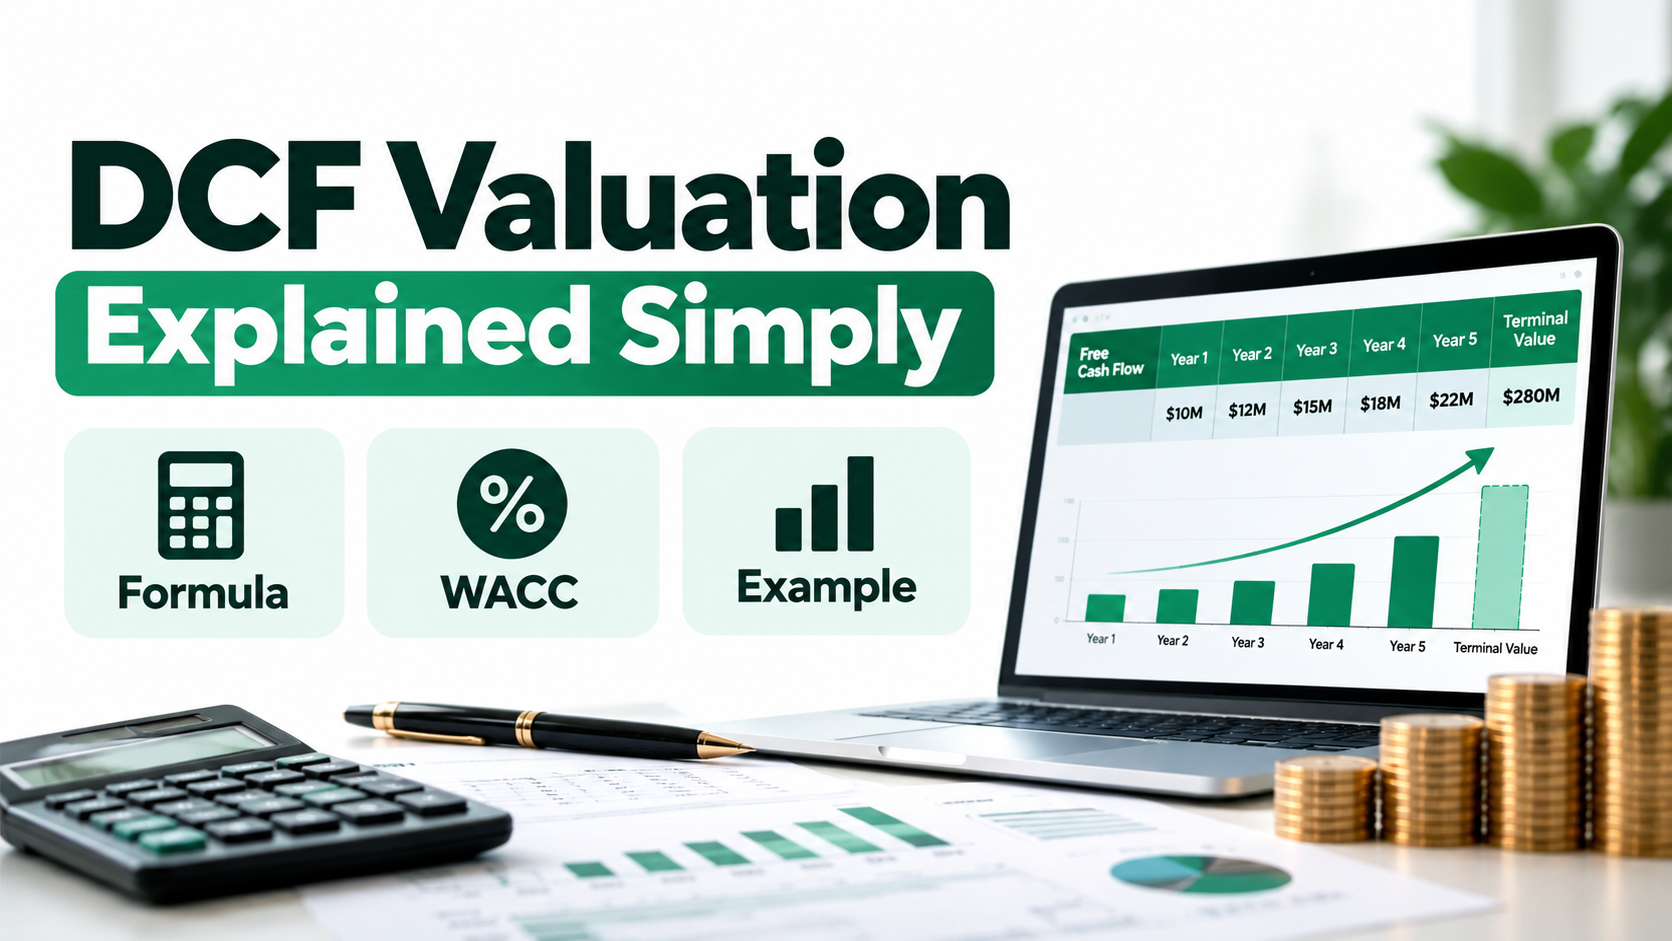

DCF Valuation Explained Simply: A Beginner’s Guide with Formula and Example
Ask three analysts what a company is worth and you’ll probably hear three different numbers. That isn’t a flaw in the method. It’s the nature of the question. DCF valuation, short for discounted cash flow valuation, is the approach most of them start from. It asks a simple question: how much cash will this business make in the future, and what is that cash worth to you today?
This guide covers the core idea, the formula, the steps, how to pick a discount rate, a worked example, and where DCF falls short.
What is DCF valuation?
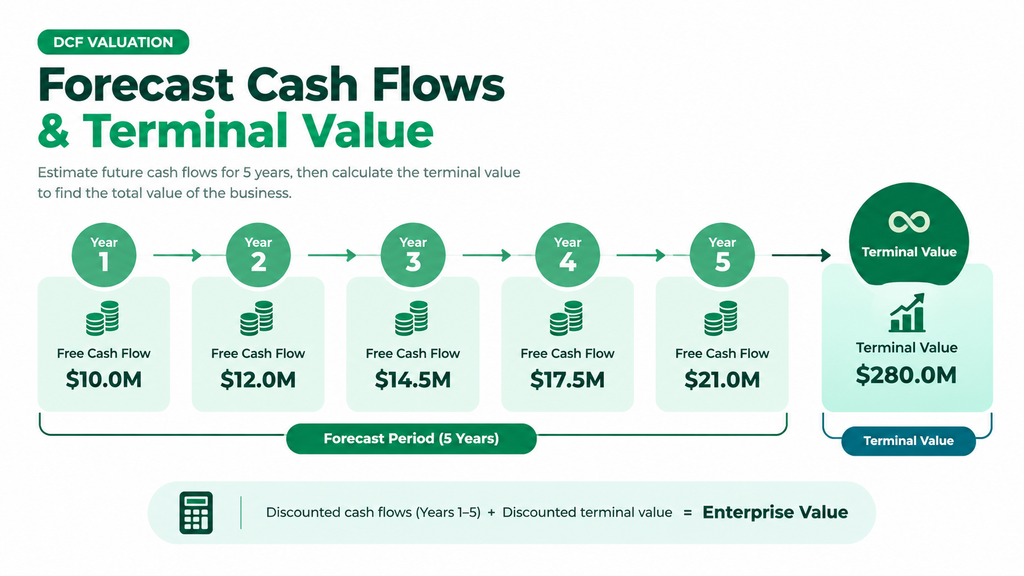
DCF valuation estimates what a business is worth today. You forecast the free cash flow it will generate, discount each year’s amount back to the present using a required rate of return (usually WACC), and add everything up. That total is the enterprise value. Subtract net debt to get equity value, then divide by shares outstanding to get value per share.
Why future money is worth less than money today
Suppose someone promises to pay you ₹1,000 a year from now. If you could earn 12% a year elsewhere, you’d only need ₹892.86 today to end up with ₹1,000 in a year. That gap is discounting. The money you have now can be invested, inflation erodes what money buys, and a promised payment might never arrive.
DCF applies the same reasoning to a whole business. Forecast the cash it produces each year, discount each year’s figure back to today, and add the results.
DCF valuation formula
Value = CF₁/(1+r)¹ + CF₂/(1+r)² + … + CFₙ/(1+r)ⁿ + TV/(1+r)ⁿ
Here CF is free cash flow in each forecast year, r is the discount rate (usually WACC), n is the number of forecast years, and TV is the terminal value. The terminal value captures every cash flow after the forecast period ends.
Terminal value formula
Terminal value is usually calculated with the Gordon growth model:
TV = CFₙ × (1 + g) / (r − g)
Here g is the long-term growth rate. The discount rate r has to be higher than g. If it isn’t, the formula stops making sense, and that’s one of the first things to check when a model gives a strange answer.
How to do a DCF valuation step by step
- Forecast free cash flow to the firm (FCFF) for 5 to 10 years. FCFF equals EBIT × (1 − tax rate), plus depreciation, minus capital expenditure and any increase in working capital.
- Estimate the discount rate. For most companies this is WACC, covered below.
- Estimate the terminal value for the years beyond your forecast.
- Discount every cash flow, including the terminal value, back to today.
- Subtract net debt (debt minus cash) to move from enterprise value to equity value.
- Divide equity value by shares outstanding to get value per share.
- Stress-test the result. Change the key assumptions and watch how much the answer moves. If a small tweak swings the value wildly, the model is telling you something important.
WACC for DCF valuation, explained simply
WACC, or weighted average cost of capital, is the blended return that shareholders and lenders expect from the business:
WACC = (E/V × Cost of equity) + (D/V × Cost of debt × (1 − tax rate))
Cost of equity is usually estimated with CAPM: the risk-free rate plus beta times the equity risk premium.
For the risk-free rate in India, analysts usually turn to the yield on the benchmark 10-year government bond. On 12 October 2026, the benchmark 6.94% 2036 bond’s yield rose to 7.37%, its highest level in about three years, as RBI liquidity measures added selling pressure (source: Kotak Neo market report). Bond yields move every day, so check the latest figure before you run a model.
The example below uses illustrative inputs: a risk-free rate of 7.37%, a beta of 1.1, an equity risk premium of 6%, a 75% equity and 25% debt mix, a pre-tax cost of debt of 9%, and a 25% tax rate. Treat these as teaching numbers, not recommendations. For a real company, source its own figures.
- Cost of equity: 7.37% + 1.1 × 6% = 13.97%
- After-tax cost of debt: 9% × (1 − 0.25) = 6.75%
- WACC: 0.75 × 13.97% + 0.25 × 6.75% ≈ 12.2%
We round this to 12% for the example that follows.
DCF valuation example, step by step
Take a hypothetical manufacturer. Its forecast FCFF is ₹100 crore in year 1, climbing to ₹140 crore by year 5. We’ll use a WACC of 12% and long-term growth of 5%.
| Year | FCFF (₹ crore) | Discount factor at 12% | Present value (₹ crore) |
| 1 | 110 | 0.8929 |
89.29 |
| 2 | 120 | 0.7972 |
87.69 |
| 3 | 130 | 0.7118 |
85.41 |
| 4 | 140 | 0.6355 |
82.62 |
| 5 | 150 | 0.5674 |
79.44 |
| Sum | 424.45 |
The terminal value at the end of year 5 is 140 × 1.05 / (0.12 − 0.05), which comes to ₹2,100 crore. Discounted back to today, that’s about ₹1,192 crore. Add the ₹424 crore from the forecast years and the enterprise value is ₹1,616 crore.
Now move to equity value. The company has ₹300 crore of debt and ₹50 crore of cash, so net debt is ₹250 crore. Subtract that from ₹1,616 crore and you get ₹1,366 crore of equity. Spread across 10 crore shares, that’s about ₹136.6 per share.
Look at where the value sits: roughly three-quarters of it comes from the terminal value. That’s normal for DCF models, and it’s why the terminal assumptions deserve the closest look.
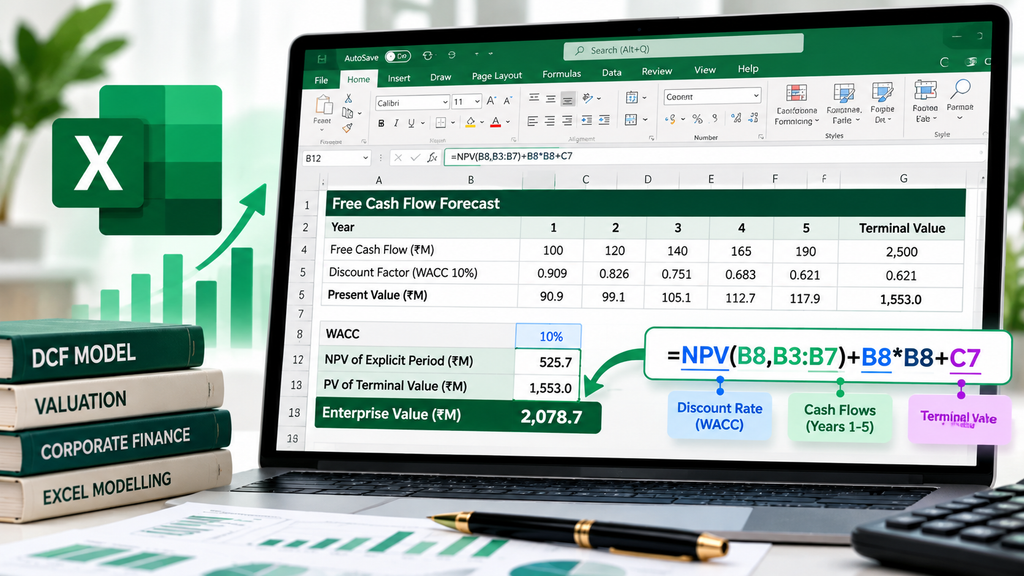
Here’s how to build the same DCF model in Excel. Put the five cash flows in cells B2 to B6, WACC in B10, and terminal growth in B11. Then enter:
=NPV(B10, B2:B6) + (B6*(1+B11)/(B10-B11))/(1+B10)^5
It returns ₹1,616 crore, matching the manual calculation. [Download the free DCF Excel template] and try your own numbers.
How sensitive is the answer?
Small changes in inputs can move the result a lot. The table compares two alternative sets of assumptions with the base case.
| Scenario | WACC | Terminal growth | Value per share |
Base case |
12% |
5% |
₹136.6 |
Higher discount rate |
13% |
5% |
₹116.1 |
Lower long-term growth |
12% |
4% |
₹120.7 |
Nudge WACC up by one percentage point and the value per share falls by about 15%. That’s why analysts usually show a range of outcomes rather than one number.
DCF vs relative valuation
Relative valuation compares a company with its peers using multiples such as price-to-earnings (P/E) or EV/EBITDA. It’s quick, and it tells you what the market is paying today. DCF works from the company’s own cash flows. It depends less on market mood and more on your assumptions. Many analysts use both: DCF to ask whether a price is supported by the fundamentals, and multiples to see how the company stacks up against its peers.
Advantages and limitations of DCF valuation
DCF’s biggest strength is that it’s built on cash rather than accounting profit, which can be shaped by accounting choices. It also forces you to write your assumptions down, so anyone can challenge them. The weaknesses are just as real. The result is very sensitive to WACC and growth, terminal value often dominates the answer, and the method struggles with companies whose cash flows are unpredictable or negative.
Common DCF valuation mistakes to avoid
- Setting terminal growth too high. If g equals or exceeds WACC, the formula collapses, and values near that point stop meaning anything.
- Forgetting to subtract net debt. The value per share ends up overstated.
- Mixing nominal and real figures. Indian bond yields are nominal, so forecast cash flows in nominal rupees too.
- Ignoring reinvestment. Capital expenditure and working capital tend to grow with the business, and your projections should show it.
- Trusting a single number. Run sensitivity checks on WACC and growth every time.
Learn to build DCF models with Arivu Skills
A DCF model pulls together forecasting, scenario testing, and messy real-world data. Those skills carry over to finance, FP&A, and business analytics roles. If you want to work with real data and build models like this one, look at Arivu Skills‘ [Data Analytics programme] and [Business Analytics programme], or our [B.Com in Financial Analytics], offered with partner colleges. You can also talk to our counsellors in Bengaluru, Chennai, or Coimbatore.
Frequently asked questions ?
What is DCF valuation in simple terms?
DCF valuation estimates what a business is worth today by forecasting its future cash and discounting that cash back to the present at a required rate of return.
What is the DCF formula?
Add up the present values of each year’s free cash flow, then add the present value of the terminal value: Value = Σ CFₜ / (1 + r)ᵗ + TV / (1 + r)ⁿ.
What is WACC and why does it matter?
WACC is the blended cost of a company’s equity and debt, and it’s the discount rate in most DCF models. A higher WACC produces a lower valuation.
Why is terminal value so important?
Forecasts rarely run beyond 5 to 10 years, so terminal value covers everything after that. In many models it makes up half or more of the total value, which is why the growth and discount rate assumptions need the most attention.
What’s the difference between DCF and NPV?
They use the same discounting logic. NPV (net present value) usually refers to a single project or investment decision. DCF values a whole business or asset by summing many years of cash flow plus a terminal value.
Can I do a DCF in Excel?
Yes. Put the forecast cash flows in a column, use the NPV function with your WACC, add the discounted terminal value, subtract net debt, and divide by shares outstanding.
Is DCF useful for startups or loss-making companies?
It’s harder to apply, because near-term cash flows are negative and the result depends heavily on assumptions. Analysts usually build several scenarios and focus on when the business is expected to turn cash-positive.
Do interest rate changes affect DCF valuations?
Yes. Bond yields and borrowing costs feed into the risk-free rate and the cost of debt. Those move WACC, which can shift the valuation a lot.
Note – This article is for education only and isn’t investment advice.