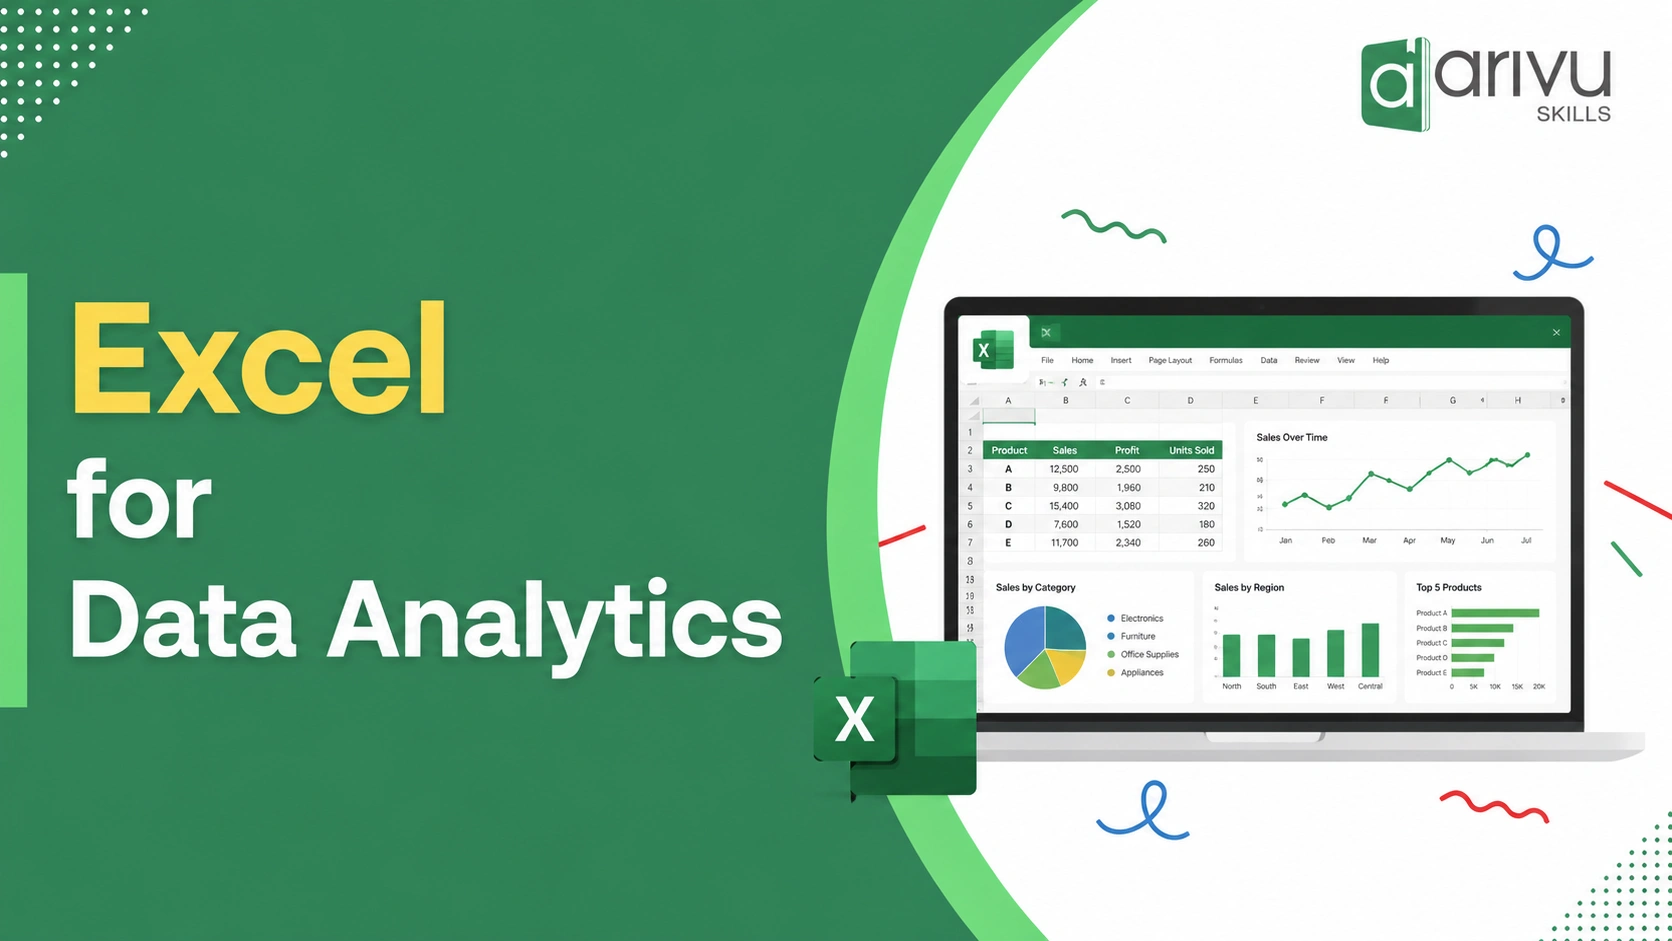

Data is everywhere today. Every business collects information about customer sales, marketing , finance and operations. But collecting data is just the first step. The real value comes from understanding what the data is actually telling you. This is exactly where Excel for data analytics comes in the picture. Even with advanced tools like power BI and tableau becoming more prominent Microsoft Excel remains one of the most widely used tools for data analysis. From small businesses to large organizations you can rely on Excel everyday to organize your data, identify trends and make Better Business decisions.
What is Excel for data analytics?
Excel for data analytics refers to using Microsoft Excel to collect, clean , organize and analyze visual data. Instead of looking through thousands of rows of numbers Excel helps you turn raw information into meaningful insights that are very easy to understand. Starting with Excel you can organize large datasets, clean inaccurate or duplicate data, perform calculations automatically and create charts and graphs while building reports and dashboards. Whether you work in finance marketing healthcare or retail Excel gives you the tools to analyze information quickly and accurately.
Why is Excel still important for data analytics?
You might assume Excel has become outdated because of the modern analytics platform. But in reality it is still one of the first tools that you can use for everyday essentials. Unlike many programming languages Excel is very easy to use even beginners can understand without any coding language. If you are comfortable using spreadsheets you can Start learning data analysis in Excel with ease. Almost every company uses Excel in some way. Sales teams prepare reports, finance teams create budgets while HR teams manage employee records and marketing teams analyze campaign performance. Not every business works with millions of records. For many organizations Excel offers everything they need to analyze daily business data quickly and effectively.
Why do businesses prefer Excel analytics?
Businesses need information that is easy to understand Click to access. This is exactly where Excel analytics becomes useful. Instead of spending hours calculating figures manually Excel performs calculations instantly and presents the results in a structured format. Some common business users include monthly sales reporting, expense tracking, customer data analysis and budget standing beside revenue forecasting.
Essential features used for data analysis in Excel
Sorting and filtering
Sorting helps you arrange information alphabetically, numerically or by date. Filtering allows you to display only records that you want to analyze.
Conditional formatting
Conditional formatting automatically highlights important information using tools. You can easily identify highest sales, lowest performing products and duplicate values. This makes large spreadsheets much easier to understand.
Formulas and functions
| Function | Purpose |
| SUM | Adds values together |
| AVERAGE | Calculates average values |
| COUNT | Counts cells containing numbers |
| IF | Performs logical calculations |
| VLOOKUP | Finds matching data from another table |
| VLOOKUP | Searches and returns matching values more efficiently |
| INDEX & MATCH | Retrieves data with greater flexibility |
| CONCAT | Combines text from different cells |
Advanced Excel tools every data analyst should know
Power query
Power query is one of the most useful features for data preparation. Instead of cleaning your data manually every time you can just automate the process. With power query you can import data from multiple sources, remove duplicate records and merge different data sets. If you regularly work with large amounts of data, power queries can save you a lot of time.
Data validation
Data accuracy is important in analytics. Data validation helps prevent users from entering incorrect information into a spreadsheet. For example you can create drop down lists, restrict data formats and allow only numbers within a specific range.
What if analysis
Businesses often need to answer queries like what happens if sales increase by 15%? How will profits change if costs rise? Excels what if analysis tool allows you to test different scenarios without changing your original data. This feature is especially important for budgeting forecasting and business planning.
Excel dashboards
a dashboard brings multiple reports and charts together on a single screen. Instead of opening several spreadsheets, decision makers can quickly view important business information in the workplace. A well designed dashboard can display monthly sales revenue growth Customer trends product performance or regional performance.
Benefits of using Excel for data analytics
There is a reason Excel has remained one of the most prominent business tools for decades. Some of the biggest advantages include easy for beginners to learn no programming knowledge required and it is available in most organizations. It is also perfect for reporting and visualization and it can handle calculations quickly. Whether you are a student or an experienced professional Excel remains a valuable skill to have on your resume.
So learning Excel for data analytics is one of the smartest steps you can take if you want to build a career in data. It gives you the ability to organize information and even perform calculations while creating reports and uncover insights that help your business make better decisions. Ready to build a career in data analytics? Start by measuring one of the most in demand tools used by businesses globally. At Arivu Skills You can learn Excel for Data analytics through expert lead training hands on projects and practical assignments that prepare you for industry challenges.
FAQs
Yes Excel is one of the most widely used tools for data analytics. It helps you organize, clean and visualize data making it ideal for beginners and professionals.
Absolutely most data analysis in Excel tasks do not require programming knowledge. You can perform calculations and create reports.
Excel is an amazing starting point but employers also value skills like power BI and statistics.
Yes companies of all sizes continue to use Excel for reporting budgeting forecasting and financial analysis.
With regular practice you can learn the basics in a few weeks. Developing advanced skills like dashboards and power query might take a few months.