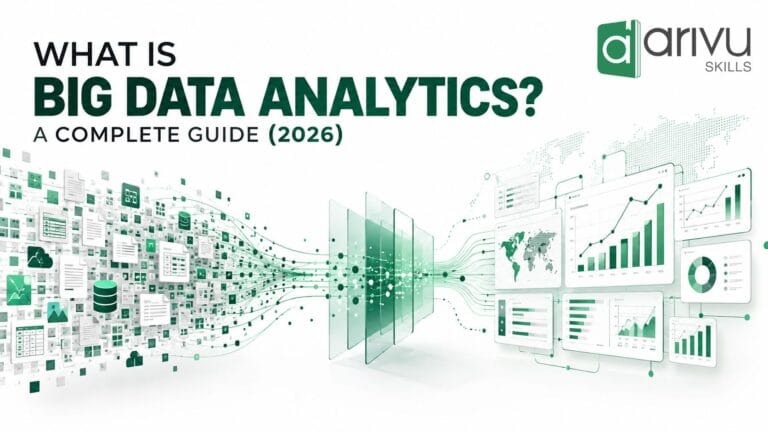
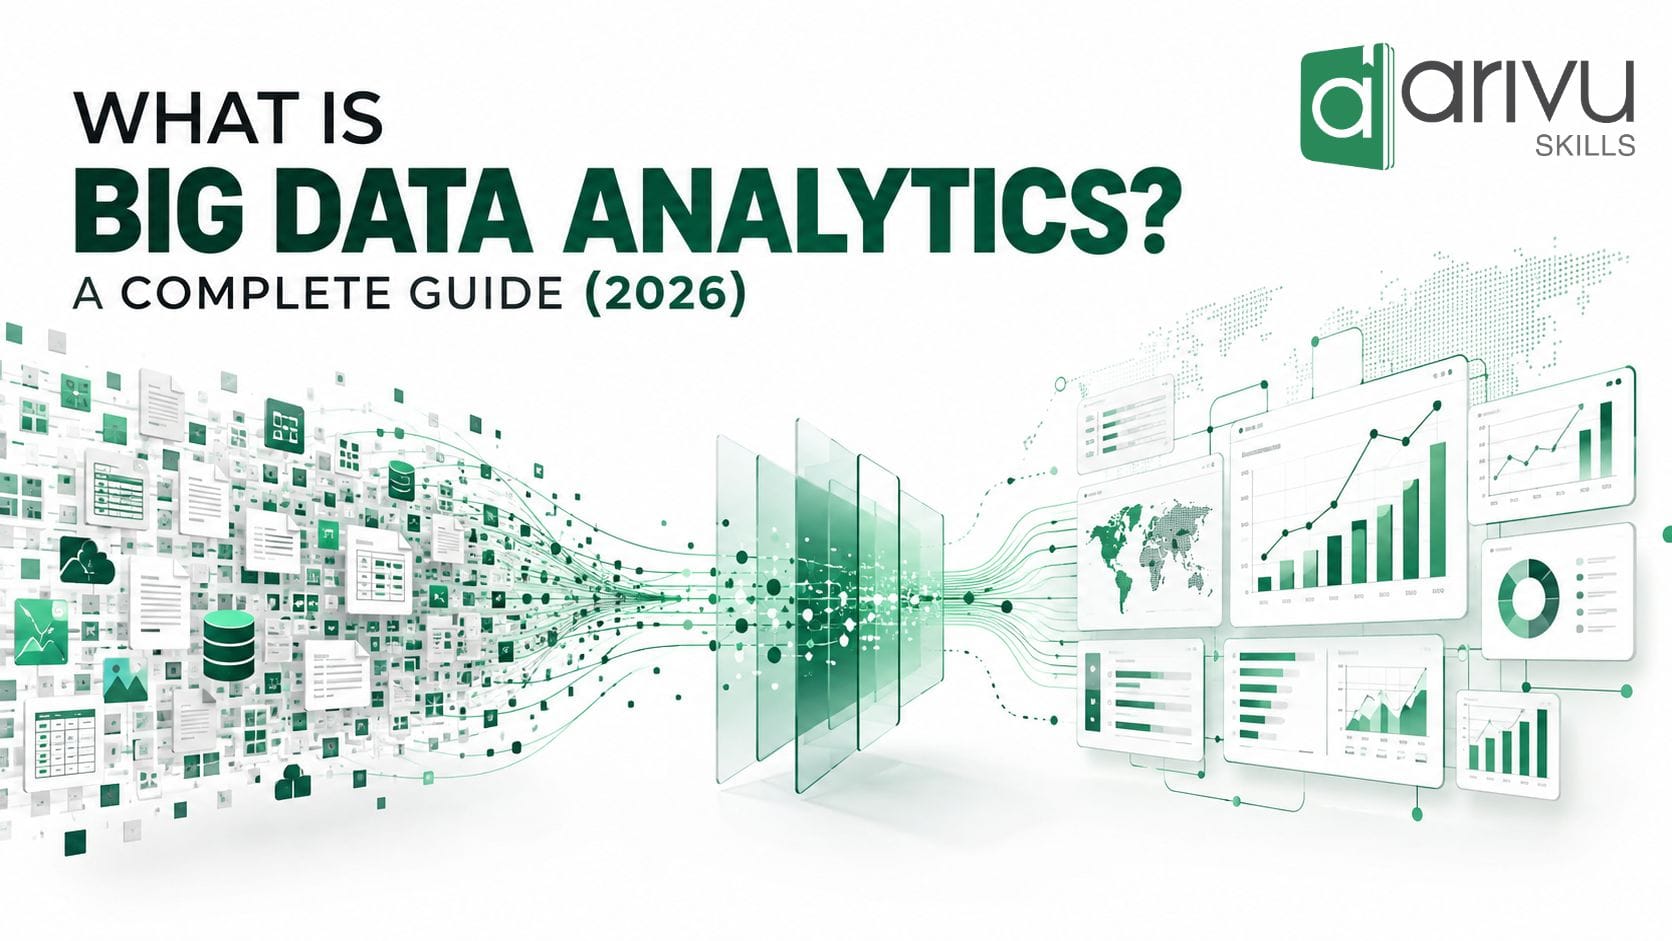

Big data analytics means studying very large and fast-moving sets of data to find patterns and insights that help people make better decisions. It uses special tools like Hadoop and Spark to handle data that is too big or too fast for normal spreadsheets and databases.
Here is the simple version. Regular analytics looks at data small enough to fit in a spreadsheet. Big data analytics looks at data that is too large, too fast, or too messy for that, and turns it into something a business can actually use.
This guide explains what big data analytics is, how it works, its main types, the methods and tools behind it, where it is used, and how you can build the skills to work in this field.
What Is Big Data Analytics?
Big data analytics is the practice of collecting, cleaning, and studying very large and complex sets of data to find useful information. This data is created all the time, from websites, mobile apps, sensors, payments, social media, and connected devices. It is usually too large or changes too fast for regular tools to handle. The point is not just to store data. It is to make sense of it, and answer questions like: what happened, why did it happen, what is likely to happen next, and what should we do about it.
Data is usually called “big data” when it has the 5 Vs:
| The 5 Vs | What it means | Simple example |
| Volume | How much data there is | Millions of daily UPI payments |
| Velocity | How fast the data arrives | Live clicks on a shopping app during a sale |
| Variety | The different formats of data | Text reviews, product photos, and server logs together |
| Veracity | How trustworthy the data is | Cleaning out spam, duplicates, and errors first |
| Value | How useful the final insight is | Spotting which customers are about to leave |
Big Data Analytics vs Regular Data Analytics
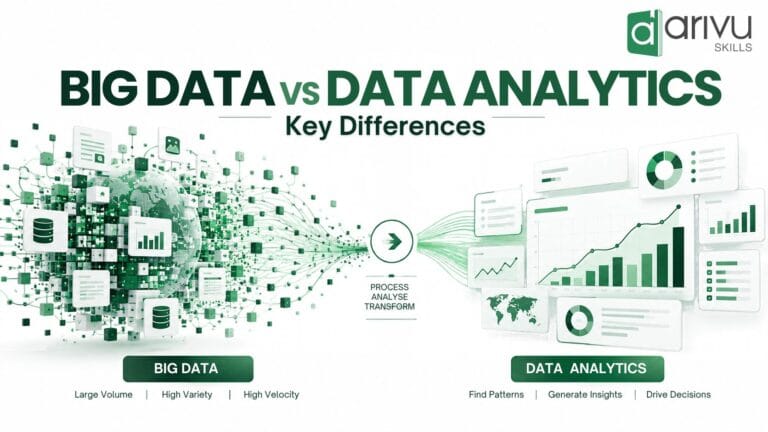
People often ask how big data analytics is different from normal data analytics. Both have the same goal, turning data into useful insight. The difference is the size of the data, the tools, and the systems involved.
| Feature | Regular Data Analytics | Big Data Analytics |
| Data size | Small (a few gigabytes) | Very large (terabytes to petabytes) |
| Data type | Mostly neat tables and rows | Tables, text, images, logs, and more |
| Speed | Updated now and then | Often live or near-live |
| Tools | Excel, SQL, basic BI tools | Hadoop, Spark, Kafka, cloud platforms |
| Systems | One server or warehouse | Many machines working together |
| Best for | Reports on known questions | Finding new patterns in huge data |
Why Does Big Data Analytics Matter?
Big data analytics matters because it helps organisations make decisions based on real evidence instead of guesswork. Companies that read their data well can serve customers better, cut waste, catch problems early, and react faster than their rivals.
In practice, it helps with a few clear things:
1) New ideas, by revealing customer needs or markets hidden inside the data.
2) Better decisions, based on what people actually do, not what you assume.
3) Personalisation, like showing the right product to the right user.
4) Saving money and time, by finding where resources are being wasted.
5) Catching risk early, such as fraud, security threats, or machine failures.
How Does Big Data Analytics Work?
Big data analytics works like a pipeline. Raw data moves through five steps: collection, storage, cleaning, analysis, and visualisation. Each step gets the data ready for the next, so scattered and messy data slowly becomes a clear answer someone can act on.
The five steps are:
1) Show the results through dashboards and charts, so people can understand and use them.
2) Collect the data from apps, websites, sensors, databases, and outside sources.
3) Store the data in systems built for scale, like a data lake (raw, flexible storage) or a data warehouse (organised, ready-to-query storage).
4) Clean the data by removing errors, duplicates, and gaps, then shaping it into a usable form.
5) Analyse the data using statistics, queries, and machine-learning models to find patterns.
Here is a quick example. A food-delivery app collects millions of orders, stores them in a data lake, removes the failed and test orders, studies which areas get busy at which times, and then shows it all on a live dashboard. The operations team can then send delivery partners to the right areas before the rush begins.
What Are the Four Types of Big Data Analytics?
There are four main types of big data analytics. Each one answers a different question, and together they move from understanding the past to planning the next step.
| Type | Question & answers | Example |
| Descriptive | What happened? | Sales fell 8% in the south zone last month |
| Diagnostic | Why did it happen? | The drop came after a stock shortage |
| Predictive | What will likely happen? | Demand will rise in the festival season |
| Prescriptive | What should we do? | Add 20% more stock in those stores |
Most real projects use these one after another. First you describe, then you find the cause, then you predict, then you decide what to do. The later types need more statistics and machine learning, which is why analytics careers usually grow in this same order.
What Methods Are Used in Big Data Analytics?
Big data analytics methods are the specific techniques used to find meaning in large data. The method you pick depends on your question and the type of data you have.
Common methods include:
-
- Data mining, which searches large data for hidden patterns.
-
- Machine learning, which trains models to predict or sort data on their own.
-
- Statistical analysis, which uses probability to check if a pattern is real.
-
- Text and sentiment analysis, which reads text like reviews or support tickets.
-
- Cluster analysis, which groups similar records, such as customer types.
-
- Association analysis, which finds things that often happen together.
-
- Real-time analysis, which studies data the moment it arrives, useful for fraud checks.
Which Tools Are Used for Big Data Analytics?
Big data analytics uses a set of tools to store, process, study, and display data. Most professionals learn a mix of them, not just one.
| Category | Common tools | What they do |
| Storage and processing | Hadoop, Apache Spark, Hive | Store and process data across many machines |
| Live data | Apache Kafka, Spark Streaming | Handle data that arrives in real time |
| Databases | SQL, NoSQL (MongoDB, Cassandra) | Store and query different kinds of data |
| Programming | Python, R, SQL | Clean, study, and model the data |
| Visualisation | Power BI, Tableau, Looker | Turn results into clear dashboards |
| Cloud platforms | AWS, Google Cloud, Azure | Run all of the above at large scale |
If you are just starting, the usual path is Excel, SQL, Python, and one visualisation tool like Power BI or Tableau. You move on to bigger tools like Hadoop and Spark later.
Where Is Big Data Analytics Used?
Big data analytics is used in almost every industry. Some of the clearest examples:
-
- Shopping and retail, for product recommendations, demand forecasts, and pricing.
-
- Banking and finance, for fraud checks, credit scoring, and risk models.
-
- Healthcare, for patient monitoring, diagnosis support, and hospital planning.
-
- Cyber security, for spotting threats hidden in huge streams of network data.
-
- Logistics and transport, for planning routes and deliveries.
-
- Marketing, for grouping audiences and checking how campaigns perform.
What Skills Do You Need for Big Data Analytics?
To work in big data analytics, you need a mix of data handling, programming, statistics, and business sense. You do not need all of it on day one. Most people start with basic data skills and build up from there.
The core skills are:
-
- SQL, for pulling and joining data. This is the skill you will use most.
-
- Python or R, for cleaning, studying, and modelling data.
-
- Statistics, for understanding averages, links, and probability.
-
- Data visualisation, using Power BI or Tableau.
-
- Big data tools, like Hadoop and Spark, as you move ahead.
-
- Business sense, for asking the right question and explaining the answer.
If you are in India and starting out, a good path begins with Excel, SQL, Python, and a BI tool. This is the same base taught in a well-planned data analytics training in Bangalore or online course, before you move on to big data tools.
Common Challenges and Limits
Big data analytics is useful, but it is not magic. A few honest limits to keep in mind:
-
- Data quality. Your insights are only as good as your data. Bad data in means bad results out.
-
- Privacy and rules. Personal data must be handled carefully. In India, the DPDP Act, 2023 sets these rules.
-
- Cost and setup. Big systems need skilled people and a budget.
-
- Skills shortage. The demand for good analysts is higher than the supply.
-
- Over-trusting data. Data should guide decisions, not replace human judgement.
Common beginner mistakes: jumping to fancy tools before learning the basics, skipping data cleaning, and building dashboards that look nice but answer no real question.
Is Big Data Analytics a Good Career?
Big data analytics has strong, long-term career value because almost every industry now creates data it needs to understand. Jobs range from data analyst and business analyst to data engineer and data scientist, and analytics is often the entry point. The good news is that you can start from a non-technical background. Many analysts come from commerce, management, or engineering, and build the technical side through step-by-step learning and real practice projects.
How to Get Started with Big Data Analytics
A simple, beginner-friendly path:
-
- Learn the basics of Excel and SQL first.
-
- Pick up Python, focusing on its data tools.
-
- Practise visualisation with Power BI or Tableau.
-
- Do real projects. A portfolio matters more than certificates alone.
-
- Move to big data tools like Hadoop, Spark, and cloud platforms.
-
- Specialise in an area like prediction, finance, cyber security, or data engineering.
The best way to make all this stick is to learn through real projects and with guidance, not on your own. Arivu Skills runs structured data analytics programmes for Indian students and working professionals. They combine these basic skills with guided, project-based practice, which is a good next step if you want to move from understanding big data analytics to actually doing it.
FAQ Section
Q: What is big data analytics in simple words?
It is the practice of studying very large and complex data to find useful patterns that help people make better decisions.
Q: What are the 5 Vs of big data?
Volume, Velocity, Variety, Veracity, and Value. These are the five traits that make data count as “big.”
Q: What is the difference between big data and data analytics?
Data analytics is the general practice of studying data. Big data analytics is the same idea, but for data too large, fast, or varied for normal tools.
Q: What are the four types of big data analytics?
Descriptive (what happened), diagnostic (why), predictive (what will happen), and prescriptive (what to do).
Q: Which tools are used in big data analytics?
Common tools include Hadoop, Apache Spark, SQL, Python, Kafka, Power BI, Tableau, and cloud platforms like AWS, Azure, and Google Cloud.
Q: Do I need coding for big data analytics?
Some coding helps. SQL and Python are the most useful, but you can begin with Excel and visualisation tools before you learn to code.
Q: Is big data analytics hard to learn?
It is manageable if you learn in order: basics first, then tools, then big data systems. Starting with the heavy tools too early is what makes it feel hard.
Q: Can I learn big data analytics without an IT background?
Yes. Many analysts come from commerce, management, or other fields and build their skills through structured courses and projects.
Q: What is big data analytics used for?
Fraud checks, product recommendations, demand forecasts, healthcare, cyber security, logistics, and marketing, among many other uses.
Q: Where should a beginner start?
With Excel and SQL, then Python, then a visualisation tool, backed by real projects, before moving to Hadoop and Spark.