
Data is all around us these days. It changes fast and there is a lot of it. But if you leave your data alone in spreadsheets or systems, you might miss some good chances. Data analytics can help you find out what your numbers are saying. It does more than showing simple reports. It helps you step into the world of business intelligence and data science. When you use data analytics, you can see new trends, find risks early, and make plans to help your business grow. This will make you stronger than your rivals and help your business succeed.
Overview of Data Analytics and Its Role in Business
Data analytics means looking at your raw information to spot patterns and trends. These patterns can help you make better decisions in your business. When you use data, you get to understand what is happening and why. This helps your group move away from guessing and make choices based on facts. Data analytics brings a culture of better decisions for your team.
It is important for a business to understand the different types of data analytics. This helps you ask the right questions and find the right answers. When you track your business performance or try to make your supply chain better, good data analysis gives you the business intelligence you need to grow in the right way. Now, we will look at some of the main ideas in data analytics.
Key Concepts in Data Analytics
Business analytics starts with raw data. This data is not processed and comes from different data sets in your company. Sales results and customer feedback are some examples. The first step is called data aggregation. In this step, you collect and organize information from many places. Doing this gets the data ready for a deeper statistical analysis.
The next step is data discovery. In this stage, you look at the prepared data. You try to find patterns or anything that seems odd. Here, summary statistics help you see what is in the data at a high level. There are types of data analysis that you use based on the question you have.
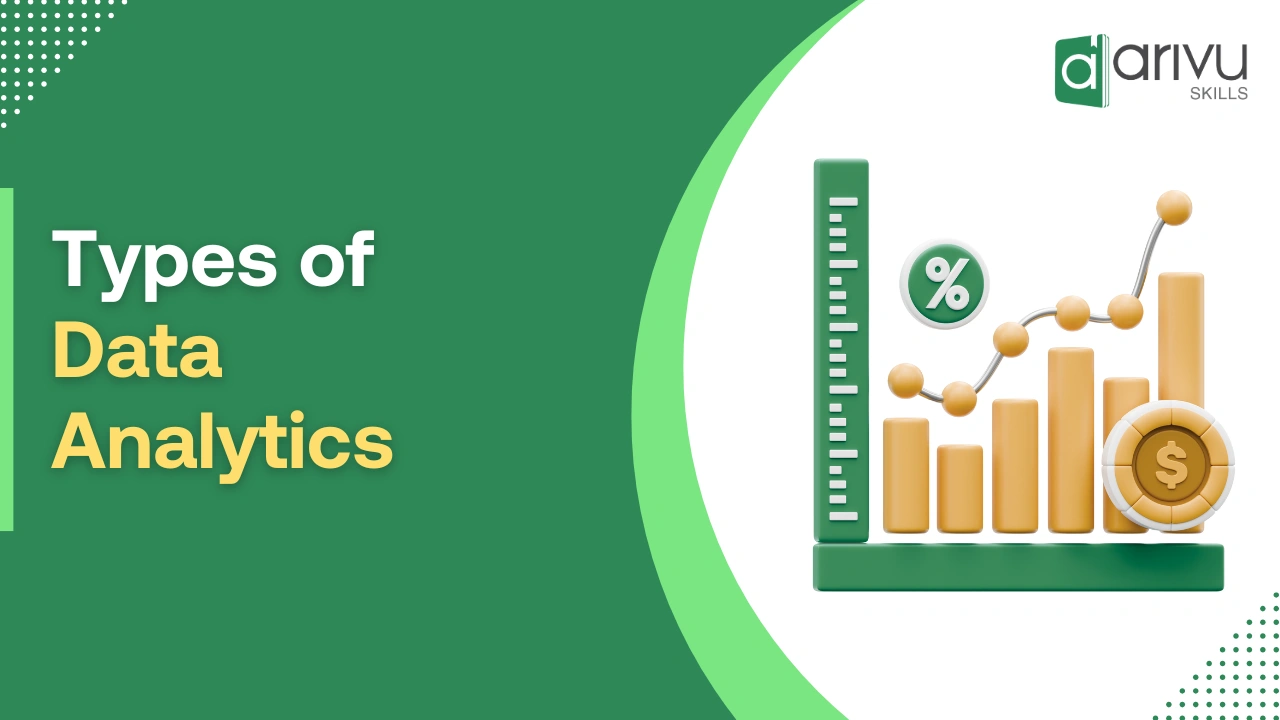
There are four main kinds of data analytics. These are descriptive, diagnostic, predictive, and prescriptive. Each type helps you in a different way. Descriptive data analytics tells you what has happened in the past. Diagnostic data analytics explains why it happened. Predictive data analytics shows what could happen next. Prescriptive data analytics suggests what action to take. Using these types, you get the information you need to move forward and make better choices.
How Data Analytics Drives Decision-Making
The real strength of analytics is that it can turn numbers into actionable insights. When you see the trends and patterns in your data, you will be able to make better decisions that help you reach your business goals. This way of working uses data instead of guesswork. It helps you use strategies that are backed by facts.
Several statistical techniques help you track key performance indicators. These tools let you see what is working and what is not. When you use business rules with your findings, you can make choices faster and with less work. This helps you keep things steady and smooth. Doing this is key to building a strong competitive advantage in a busy market.
Descriptive analytics is the type of data analytics most people use first when making decisions. It is the starting point because it helps you see how things went in the past. There are other types of data analytics too. Each type helps us get more information. As you use these types, you learn more, and it helps you make better choices. All of them are important, but descriptive analytics gives you the basics to begin with.
Importance of Understanding Data Analytics Types
Knowing about the different types of analytics is very important. Not all business problems are the same. Every type of data analysis can answer a different question. Some tell you what happened. Others help you know what to do next. This helps you use the right method for the right problem and get better results with data analysis.
This focused way to use business intelligence helps you do more than just look at data. You start using it to get ahead in the market. If you want to find out why sales went down or look into customer behavior, knowing the reason for each kind of analytics lets you find the best answer fast.
In the end, this understanding gets your organization ready for future trends and any big challenges. It gives you a set of tools you can use to make business performance better in every part of the company. When you get good at using different ways of analytics, you can build a team that can move fast, handle change, and think ahead.
Exploring the Main Types of Data Analytics
To get the most out of your data, you need to know how to analyze it in different ways. There are four main types of data analytics. These are descriptive, diagnostic, predictive, and prescriptive. Each type has a special role to play, starting from when you have raw data, all the way to clear steps you can take. One type of analysis builds on the previous one. This helps you get better understanding and useful advice from your data each time.
In the next parts, we will look at each of these business analytics methods. You will get to learn how descriptive analytics helps you sum up what happened in the past. You will also see how prescriptive analytics lets you know about the steps you should take in the future. When you put these tools together, you get a full data science plan. This way, you can use business analytics to help make better choices.
Descriptive Analytics Explained
Descriptive analytics in data analytics is when you look at historical data to see what has happened before. This is usually the first step in data analysis. It gives you a clear picture of your business performance. You can think of it like a foundation that other insights build on.
This type of descriptive analysis puts together data using data aggregation and summary statistics. It shows information in a way that is easy to read and understand. People often use data visualization tools like charts, graphs, and dashboards for this. For example, a retail company can look at the sales in each region from the last quarter. A hospital can use it to see how many patients came in over time.
Descriptive analytics gives clear facts about things that happened before. It helps everyone see where the business stands now. This is important because it answers the question, “What happened?” Descriptive analytics helps start the search to find out why things happened the way they did.
The Role of Diagnostic Analytics
Diagnostic analytics builds on descriptive analytics. It looks deeper to find the root cause of what happened. The main aim of diagnostic analytics is to answer, “Why did this happen?” When you notice a sudden rise or fall in your data, diagnostic analytics tools help you see what caused it.
Diagnostic analytics is not the same as other types of data analytics. Descriptive analytics tells you what happened. Diagnostic analytics helps you see why it happened. It works by using things like data discovery and drill-downs to search your historical data. It helps find patterns and things that are not normal. For example, if a hospital gets more ER patients, diagnostic analytics can look at patient symptoms and find if they all have a common illness. This is the way you use diagnostic analytics to learn more from your
data.
This way of looking at cause and effect is important in business intelligence. It helps you see why things happened in the past. With this knowledge, you can find actionable insights. You can use these to stop problems before they start or copy what worked well. Many people use methods like regression analysis to find these hidden patterns.
Predictive Analytics Methods
Predictive analytics helps you use historical data, statistical models, and machine learning to guess what might happen in the future. This way, you do not just react to things that happened before. You get to look ahead and plan for future outcomes. It helps your team get ready for future trends and make better choices before things happen.
Techniques like time series analysis, regression analysis, and predictive modeling are very important in this process. These methods help you find the patterns in your data and use them to guess what could happen next. What are some examples of predictive analytics? Here are some common use cases:
- A company that makes things looks at sensor data to guess when a machine might stop working. They can then plan repairs before there is a problem.
- A healthcare group tries to guess how many patients will come back to the hospital again. They use old health records and see what trends come up.
- A sales team guesses which deals will close based on what buyers did before and how long older sales took.
With these insights, the business can use its resources in a better way. It can lower risks. The business can also find and take new chances before they come.
Prescriptive Analytics Applications
Prescriptive analytics is the most advanced form of analytics. It helps you see what could happen next and also tells you what you should do about it. This type of analytics uses artificial intelligence, data modeling, and business rules to suggest what steps you should take so you can get the outcome you want.
Prescriptive analytics goes further than just looking ahead. It gives you clear, actionable insights. When you use it, you can see how different choices might play out. It helps you know what may happen based on your decisions. This is when business intelligence turns into a real guide. It shows you the best way to move ahead.
For example, a supply chain team can use it to make delivery routes better by looking at traffic and weather at that time. An e-commerce company can use it to suggest product bundles just for you. They do this by looking at customer behavior and inventory levels. It’s all about turning data into a clear and useful plan.
Cognitive Analytics – The Next Frontier
Besides the main four types, there is something new called cognitive analytics. It uses artificial intelligence and machine learning to copy how humans think. You might ask if there are more than four types of data analytics. The main four types are still important, but cognitive analytics is the next step. It mixes parts of all the main types and makes the system smarter with help from artificial intelligence and machine learning.
A big strength of cognitive analytics is that it can read and understand unstructured data. This can be text from emails, social media posts, or customer service chats. The system uses natural language tools to read this text and find meaningful insights. These are things that older ways may not notice or pick up.
This technology is changing how people use data analysis. It helps people ask questions in plain, everyday language. They get answers that fit their needs. As AI gets better, cognitive analytics will be even more important. It will help businesses understand big data in better ways. The world of big data is huge and complex. In the future, cognitive analytics will lead new trends and help us make sense of it all.
Differences Between Types of Data Analytics
There are different types of analytics, and each gives value by looking at data in its own way. Each form of analytics has its own use, answers its own question, and needs its own way of data modeling and study. Knowing how they are not the same helps you to build a good business analytics plan.
What are the main types of data analytics and how are they different? In the next few sections, you will see a direct comparison of the four main types. There will also be an explanation of when to use each one. This can help you know how they work as a group for a complete data analytics journey, starting from your first look at the data and finishing with a smart and clear action.
Comparing Descriptive, Diagnostic, Predictive, and Prescriptive Analytics
There are four main types of analytics. Each one helps you in a different way. Descriptive analysis tells you what happened. Diagnostic analytics helps explain why it happened. Predictive analysis lets you know what is likely to happen next. Prescriptive analytics gives advice on what to do about it. When you use all these types of analytics together, you get strong support for better decision-making.
Their ways of working are quite different. Descriptive and diagnostic analytics look back at what has already happened. They use historical data to understand the past. On the other hand, predictive and prescriptive analytics look ahead. They use past data to help guess what may happen and to plan the next steps for future outcomes.
Here is a table that shows the main features for each type of analytics:
| Feature | Descriptive Analytics | Diagnostic Analytics | Predictive Analytics | Prescriptive Analytics |
| Purpose | Summarize what happened | Explain why it happened | Forecast what will happen | Recommend what to do |
| Data Usage | Historical data | Historical data | Historical & current data | Historical & current data |
| Key Question | What happened? | Why did it happen? | What will happen? | What should we do? |
| Outcome | Reports, Dashboards | Root cause analysis | Forecasts, Models | Recommendations, Actions |
When to Use Each Type of Data Analytics
How do you pick the best type of data analytics for your needs? The answer depends on the business problems you want to solve. You need to match the type of data analytics with your own goals. This way, you can get more actionable insights and use them to make better decisions.
Start by stating your question clearly. Do you want to look at past results, find an issue, guess a trend, or improve what happens next? Your answer will help you pick the right type of analytics. Things outside your company, like changes in the market or new rules, can also decide which use cases matter most.
Here are a few ways you can use this in real life:
- Use descriptive analytics to make monthly reports on sales KPIs. These reports help you see how your team is doing.
- Apply diagnostic analytics if a marketing campaign does not do well. This can help you find out which audience or channel caused the problem.
- Use predictive analytics to look at past sales and predict what inventory you will need for the holiday season.
How Data Analytics Types Work Together
Yes, businesses can use more than one type of data analytics at the same time. In fact, the best strategies use several types of analytics together. This helps to get a full and clear view of things. The type of data analytics you use works with others, so they help each other. This way, businesses can go from seeing new information to taking action right away.
The process usually begins with descriptive analytics to help you get a clear idea of what is happening. If you notice anything unusual, you can move to diagnostic analytics to see what caused it. After that, you might use data modeling to try and guess what could happen next. Prescriptive analytics will then help guide you by showing the best thing to do based on some set business rules.
This way of working together brings great changes in how well things get done and how well everything works. When you use both of these ways as one, you start a loop where you always look into your data and make things better. This turns your data into something strong that helps you get actionable insights and grow in a smart way.
Real-World Applications and Examples of Data Analytics
Data analytics is not only a big idea; it is a real tool used by many industries to help business performance. Companies in retail, finance, healthcare, or manufacturing use business intelligence to look at large data sets. This helps them get actionable insights. A good data analyst or data science team can find chances for the business that people did not see before.
Many industries use data analytics. They use it in different ways. The next sections will show how data analytics helps in the main areas of a business. This includes marketing, sales, operations, and HR. You will see how it can be useful in these fields and the big impact it has.
Level up your career with the best Data Analytics course in Bangalore. Join now.
Data Analytics in Marketing Strategies
In marketing, data analytics helps us see what customers do and how they feel about different marketing campaigns. Marketers use descriptive analytics to watch important numbers like engagement, conversions, and how much money is spent on ads. This information shows the real effect that marketing campaigns have on business performance.
When a campaign does not reach its goals, diagnostic analytics helps marketers look closer to see why this is happening. They can check different things like trends in each area, how people react, and changes in the message. This helps to spot what goes wrong. Later, predictive analytics can be used to guess which plans will work best in the future.
Here are a few examples of the way businesses use analytics in their marketing strategies:
- Split customers into groups by looking at what they bought before. This helps send email campaigns that feel personal to them.
- Try A/B testing to see what website headline will get more people to buy or sign up.
- Guess which customers might leave. Offer them deals before they go to help keep them.
Improving Sales and Customer Service with Analytics
Sales and customer service teams use data analysis to be more effective. They look at customer behavior to understand what people want and need. This helps these teams get actionable insights for making better decisions. With this information, they can improve how they connect with customers. This way, customer service becomes stronger, leading to better results for everyone.
For example, a sales manager can use descriptive analytics to look at how their team is doing and what deals are in the pipeline. After that, they might add on some predictive models to see which deals are most likely to close. This business intelligence lets sales reps spend their time on the leads that look best.
In customer service, looking at support ticket data helps you find out what problems happen often. The team can use this to make useful resources or to make product features better. When you use this kind of data, sales and service can get ahead of problems. It also means they really understand what customers need.
Optimizing Operations Using Data Analytics
Data analytics helps make things work better in a company. It is important for improving how things run and raising operational efficiency. If a business does a lot with logistics, like in manufacturing or retail, data analytics can help a lot. It lets these companies see what is going on in their work, so they can make things smoother and save money. These changes can have a good effect on business performance.
Operations leaders use descriptive analytics to keep track of important numbers like how many orders get filled and how long delivery takes in the supply chain. When something goes wrong, like a supplier is late or there are not enough staff, data analysis helps them see where the problem starts, so they can fix it fast.
With prescriptive analytics, you can get helpful tips on what to do next. For the supply chain, it can point out ways to fix problems, like sending shipments on a new route or moving resources so things keep running smoothly. This real-time system can watch, find issues, and help you act fast. It helps the supply chain stay strong and work well.
HR and Workforce Planning Through Analytics
Human resources teams are now using data analytics to help with planning and managing workers. They look at many data sets about employees. This helps HR workers do more than just paperwork. They can now help the company reach its main goals.
For example, HR teams use descriptive analytics to see trends in employee turnover and how engaged people feel in different groups. If they notice that one group has more people leaving than others, they can use diagnostic analytics to find out why. It could be about manager feedback, onboarding, or how much work there is.
This business intelligence helps HR spot gaps early and take steps to fix them. It can also make things better for the people who work in the company. With future trends in HR analytics, companies will know earlier what hiring is needed, where they have skill gaps, and how to build a team that cares more and works better.
Conclusion
To sum up, the different types of data analytics are important for any business that wants to make better choices. Each type—descriptive, diagnostic, predictive, and prescriptive—can give you something different that helps your business. When you use data analytics the right way, you can boost your marketing, make your customer service better, and also help the overall performance of your company. If you mix these kinds of analytics, you get a bigger and better look at what is happening in your business. If you want to know more or get better at this, you can sign up for our data analytics course in Bangalore at Arivu Skills. Make use of data and give your business the power to do well.
FAQs
The best type of data analytics for a business will depend on what you want to do. Descriptive analytics and diagnostic analytics help you see how your business is doing right now and understand why things happen. If you want your business to grow, you need to use predictive analytics and prescriptive analytics. These will give you important and actionable insights to help you stay ahead of others.
Most people and companies do well when they use every type of data analytics together. This way, you understand your business performance better and can make the right choices.
Yes, businesses can use more than one type of analytics at the same time. The types of analytics work well together. Descriptive analytics gives a basic look at the data. Diagnostic analytics helps to tell why something happened. Predictive analytics can show trends coming up. Prescriptive analytics gives the business some clear steps to take. When you use all these together, you get better decisions and your business analytics become stronger. It also helps to make your data modelling more solid, and you get more actionable insights.
To pick the right type of analytics, you should begin by knowing your business problems. If you want to see how things went before, you need descriptive analytics. When you have to find the root cause of a problem, go with diagnostic analytics. If you are looking to guess what will happen next, use predictive analytics. If you want to get advice on what step to take, use prescriptive analytics. Matching each type of analytics to real use cases can help you get a competitive advantage.
Many industries such as retail, finance, healthcare, and manufacturing use data analytics a lot. They use it to make marketing campaigns better, to make the supply chain work smoother, and to predict financial trends. It also helps them to improve how well patients get care. When businesses use data visualization, they can show hard-to-understand insights in a clear way. This helps people work better and helps improve business performance in every sector.
There are four main types: descriptive analytics, diagnostic, predictive, and prescriptive analytics. Descriptive analytics tells us what happened. Diagnostic tells us why it happened. Predictive tells us what will happen. Prescriptive analytics tells us what we should do. Each one helps with business intelligence, letting us understand the past and plan for the future.