
In today’s data-driven world you might generate a huge amount of information every day. From sales reports and customer behaviour to marketing performance and financial records companies need a way to understand all this data quickly and effectively. Is exactly where power BI for data analytics comes in the picture.
Power BI has become one of the most prominent business intelligence tools because it helps organizations transform raw data into meaningful insights whether you are a student or a working professional learning power BI can open up amazing career opportunities.
What is Power BI?
It is a business analytics and data visualization tool developed by Microsoft. It allows you to connect data from different sources, analyze information and create reports. Instead of looking at hundreds of rows in spreadsheets, power BI helps you visualize data through charts, graphs and maps that are easier to understand. Businesses use power BI to monitor performance, identify trends and make informed decisions based on real time information.
Turn data into decisions—enroll in a top Data Analytics course in Chennai and future-proof your career.
Why is Data Analytics Important?
Every business collects data but data alone has little value unless you analyze it and also understand it. Data analytics helps organizations improve decision making, understand customer behavior, reduce operational costs and also track performance. The growing importance of data that’s one reason why experts skilled in power BI for data analytics are in high demand.
Why Power BI is Prominent for Data Analytics?
There are many analytics tools available today but power BI has gained widespread popularity because it combines powerful features with ease of use. Some advantages include user friendly interface real time reporting and cloud accessibility.
Main Features of power BI
Power BI can connect with different data sources including excel spreadsheets data sets and CRM systems besides ERP software. This flexibility allows you to bring all the data into one place. Raw data is often messy and difficult to analyze. Power BI includes tools that help you clean data, remove duplicates and fix errors. This process ensures more accurate pricing. One of the biggest strengths of power BI is its visualization. You can create bar charts and pie chart line graphs. These visual elements help you understand complex data more quickly.
Data Analysts are in demand—upgrade your skills with a professional Data Analytics course in Bangalore.
Understanding of Power BI Dashboard
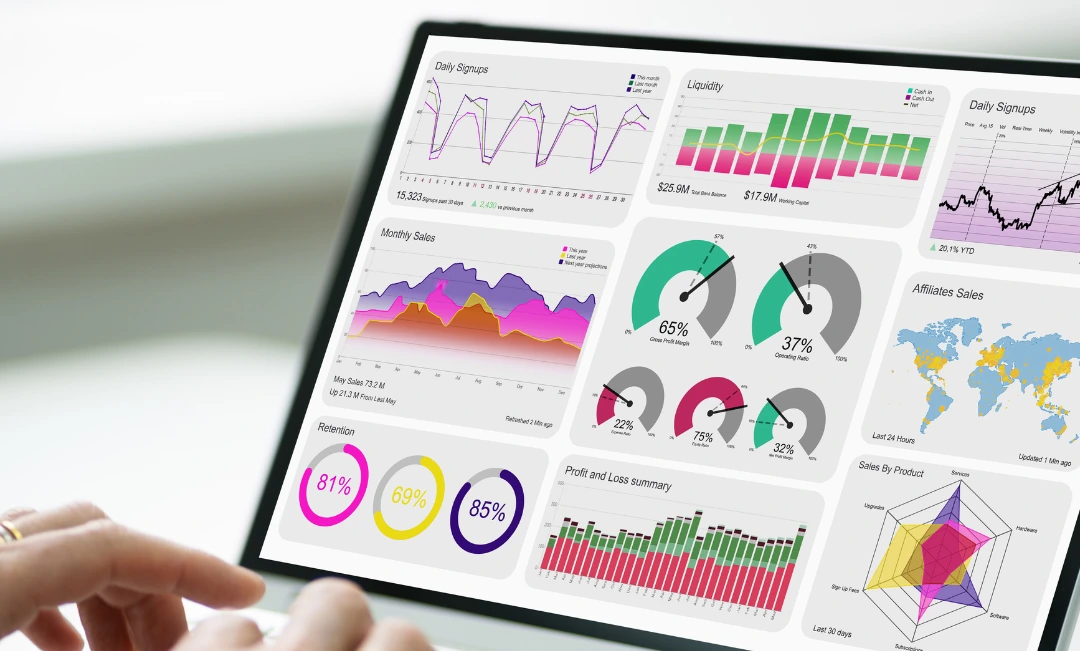
A power BI dashboard is actually a visual summary of major business metrics displayed on a single screen. You can think of it like a panel for your business performance. A dashboard can display sales figure revenue growth, customer acquisition and marketing performance. Instead of opening multiple reports you can view all important information in one place.
Benefits of Power BI Dashboard
| Benefit | Description |
| Real-Time Insights | Monitor business performance instantly |
| Better Decision-Making | Access important data quickly |
| Improved Productivity | Reduce manual reporting work |
| Data Visualization | Simplify complex information |
| Centralized Reporting | View multiple metrics in one dashboard |
How Power BI Helps Different Industries?
If you run a retail business you can use power BI to track sales performance, monitor inventory and also analyze customer behavior. As a healthcare organization you can use power BI to monitor patient data track treatment outcomes while improving operational efficiency and analyzing healthcare trends. Furthermore, financial professionals use power BI for budget tracking, revenue forecasting and risk management.
Why Learn Power BI?
Organizations across India are hiring professionals who can analyze data and create business Insights. Power BI skills can help you pursue roles like data analyst, business analyst, and reporting analyst. As businesses become increasingly data-focused, demand for Power BI professionals continues to grow. Compared to many advanced analytical skills Power BI is really beginner-friendly. Even individuals with basic Excel knowledge can start learning Power BI quickly.
What will you learn in a Power BI course?
You can learn the Power BI interface, data connections and report creation. Topics generally include data cleaning, data transformation and data modelling. As a student you can also learn how to create charts, graphs and interactive reports. You can also learn best practices for creating professional and user friendly dashboards.
Essential Skills for Power BI Professionals
No doubt power BI is important but combining it with other skills can make you even more valuable. Useful skills include SQL data analytics statistics and problem solving.
Common Challenges When Learning Power BI
You might struggle with relationships between data sets. You need to practice and even get on hands-on projects to help overcome this challenge. Creating visually appealing dashboards takes time and experience. Studying real world examples can improve design skills.
Tips for Becoming a Successful Power BI Analyst
You need to work on actual business datasets whenever possible. Creates sample dashboards that demonstrate your skills and learn SQL as it complements power BI and improves data analysis capabilities.
The Future of Power BI and Data Analytics
The future of data analytics looks really promising. As you continue collecting large amounts of information, the need for data professionals will continue growing. Power BI is expected to remain one of the leading analytics tools because of its flexibility and cloud integration.
So you must know that data has become one of the most valuable assets for modern businesses and organizations need professionals who can turn that data into meaningful insights. This is the only reason why power BI for data analytics has become so important in today’s job market.
Start with the fundamentals, work on real-world datasets, and build interactive dashboards that employers value. At Arivu Skills, you’ll learn Power BI through hands-on projects, expert guidance, and practical assignments that prepare you for real industry challenges.
FAQs
Power BI is basically used to analyze data and create visual reports while building dashboards.
Yes power BI as a user friendly interface is considered one of the easiest business intelligence tools.
Basic power BI function will not require any coding. But learning SQL can have other analytical capabilities.
Yes a structured power BI course helps you understand data visualization and dashboard creation that are valuable in today’s job market.
Power BI is widely used in industries such as finance, healthcare, retail, manufacturing, education, logistics, and IT to analyze data and support business decisions.