Business Analytics Online Course
Become a skilled Business Analyst from anywhere with our flexible online course. Gain hands-on experience through real-time projects, master in-demand tools like Excel, Power BI, and Tableau, and receive dedicated placement support. Build a successful career in one of today’s fastest-growing business domains—at your own pace, anytime, anywhere.
Talk to a Consultant
Fill in the details to get started
Key Features of Business Analytics Online Course
- 100% Placement Assessment
- Guaranteed Internship
- IBM Certification
- Complete Hands-On Training
- Mock Interviews
- Complete Hands-on Training
- 3 Tools Specialization
- 24-Hour Doubt Clarification
Why Choose Arivu Skills for Business Analytics Online Coaching?
100% Placement Assistance
Get complete support with resume building, interview prep, and job opportunities.
Guaranteed Internship
Gain real industry exposure through a guaranteed internship program.
Mock Interviews
Attend real-time mock interviews to build confidence and crack job interviews.
IBM Certification
Earn a globally recognized IBM certification to boost your career credibility.
Complete Hands-on Training
Learn by doing with practical sessions, live exercises, and real projects.
Capstone Project
Work on a real-world capstone project to showcase your end-to-end skills.
3 Tools Specialization
Master 3 in-demand tools used widely in the industry.
Industry-Relevant Curriculum
Curriculum designed based on current industry trends and job requirements.
Real-World Use Case Training
Learn through practical use cases and business scenarios.
Dedicated Mentor Support
Get continuous guidance from experienced mentors throughout the course.
24-Hour Doubt Clarification
Clear your doubts within 24 hours with dedicated support.
Career Guidance & Roadmap
Receive a clear career path and learning roadmap tailored to your goals.
Career Guidance & Roadmap
Start from basics and move to advanced concepts step by step.
Flexible Learning Path
Learn at your own pace with flexible schedules and structured modules.
Who Can Join Business Analytics Online Classes ?
- Fresh graduates looking to start a career in Business Analytics
- Working Professionals planning to switch into analytics roles.
- Students from Any Degree Background (B.Com, BBA, B.Sc, BCA, B.Tech, MBA, etc.)
- IT & Non-IT professionals interested in data-driven business roles, reporting, and data visualization using Excel, Power BI & Tableau
- Finance & Accounting professionals who want to upgrade with Excel, Power BI & Tableau skills
- Entrepreneurs & Business Owners seeking data-driven decision-making skills.
- Career break professionals looking to restart their career in Business Analytics
Significant Demand Growth Since 2022
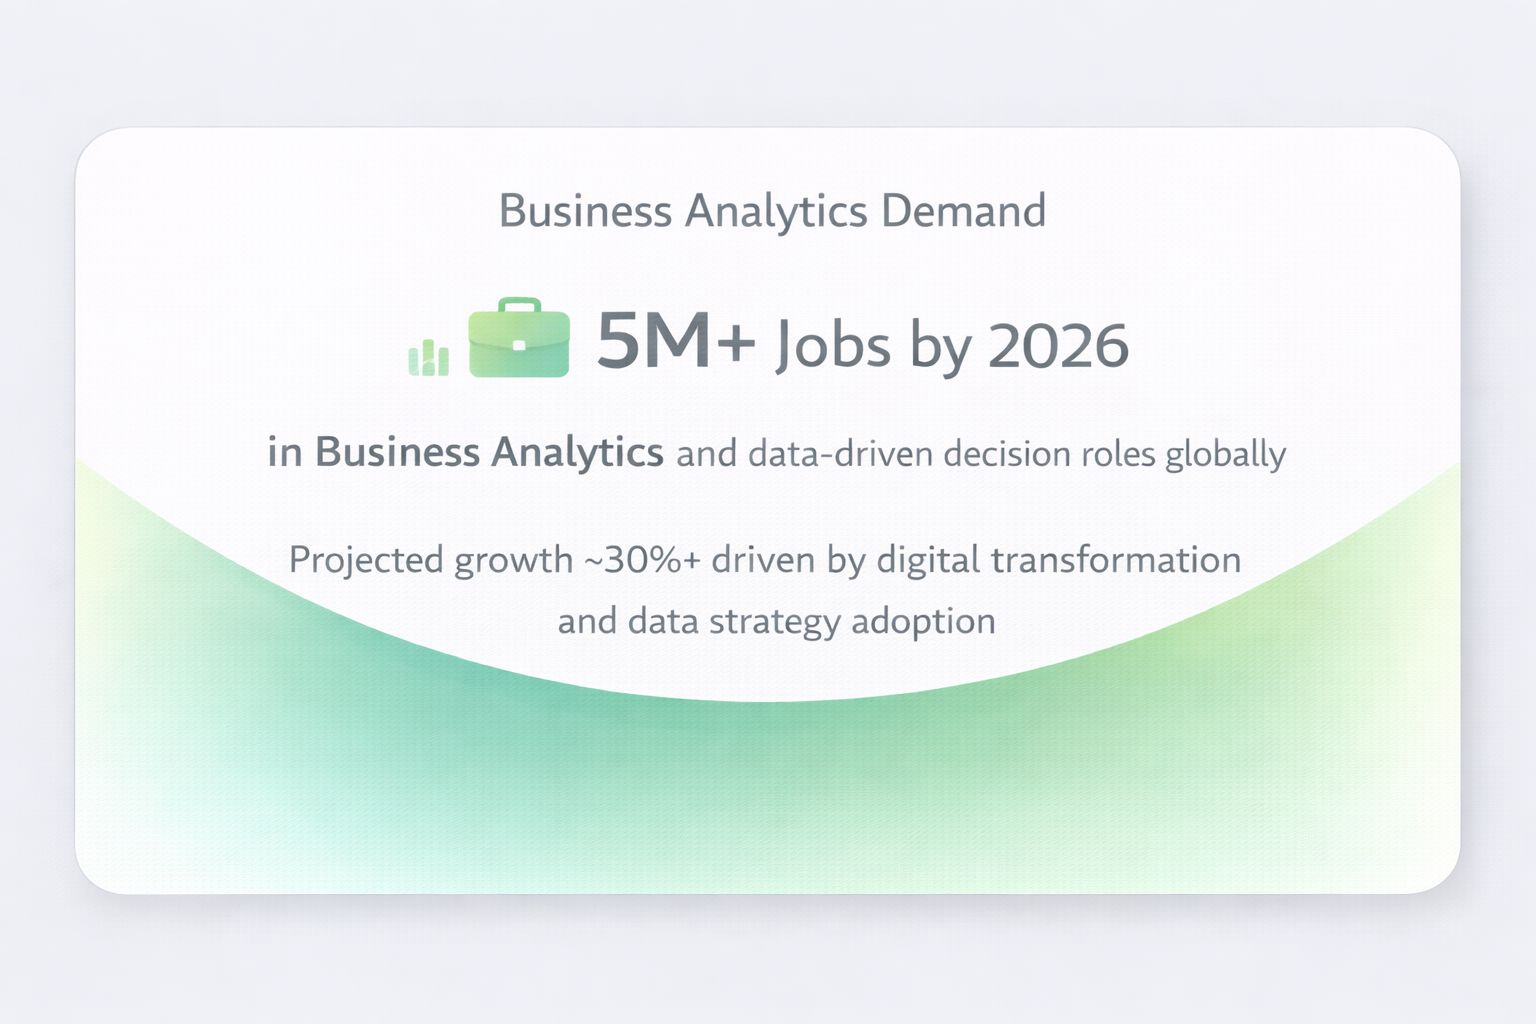
The demand for Business Analytics professionals is rapidly increasing as companies rely on data-driven insights for smarter decision-making and business growth. Data-related roles are projected to grow significantly over the next decade, making analytics one of the fastest-growing career paths.
Enter this high-demand industry with the Business Analytics Course from Arivu Skills, where you will master Excel, Power BI, and Tableau in just 2 months with hands-on training and real-time projects.
Testimonials
Rajiv Singh
Nitish Sharma
Dimple Prasad
Let's walk you through the journey at ArivuSkills

Course Curriculum
Our Business Analytics Course is designed by industry experts to provide strong academic and industry exposure. We offer a balanced combination of theoretical, technical, and practical knowledge with complete hands-on training in Excel, Power BI, and Tableau, suitable for learners from any background within 2 months.
- 6 Months
Excel
➔ Excel
➔ Module 1: Data Management in Excel
– Data Cleaning and Preparation: Removing duplicates, handling missing data.
– Managing Large Datasets: Using Freeze Panes, Filters, and Excel Tables.
– Advanced Filtering and Sorting: Custom sorting and filtering techniques.
– Using Excel Tables: Structured references and data organization.
➔ Module 2: Data Analysis and Charting
– PivotTables and Pivot Charts: Creating and customizing PivotTables and charts.
– Slicers and Timelines: Dynamic filtering of PivotTables and charts.
– Advanced Charting: Creating Waterfall, Funnel, and Combo charts.
– Conditional Formatting: Highlighting data patterns with color scales and icons.
➔ Module 3: Excel Formulas
– Logical Formulas: IF, AND, OR for decision-making.
– Lookup and Reference: VLOOKUP, INDEX, MATCH, XLOOKUP.
– Mathematical and Statistical: SUM, AVERAGE, COUNTIF, STDEV.
– Text and Date Formulas: CONCATENATE, LEFT, RIGHT, DATE, NOW.
➔ Module 4: Data Validation and What-If Analysis
– Data Validation: Creating drop-down lists and setting entry rules.
– Named Ranges: Simplifying formulas and improving workbook clarity.
– What-If Analysis: Using Data Tables for scenario analysis.
– Scenario Manager and Goal Seek: Managing scenarios and reverse calculations.
➔ Module 5: Dashboard Creation and Consolidation
– Data Consolidation: Merging data from multiple sources.
– Dashboard Creation: Building interactive dashboards with PivotTables and charts.
– Advanced Excel Functions: Integrating formulas and charts in dashboards.
– Final Project: Creating a complete dashboard using learned skills.
Power BI
➔ Power BI
➔ Module 1: Introduction to Power BI
– Getting Started with Power BI Desktop and its interface.
– Importing and transforming data from different sources.
– Basic Data Modeling: Creating relationships and calculated columns.
– Creating basic visualizations and publishing reports to Power BI Service.
➔ Module 2: Data Transformation and Advanced Modeling
– Advanced Data Transformation techniques using Power Query Editor.
– Using DAX for creating calculated columns, measures, and advanced calculations.
– Working with Time Intelligence functions.
– Building complex relationships and optimizing data models for performance.
➔ Module 3: Visualizations and Reports
– Creating advanced visualizations: bar charts, line charts, pie charts, and combo charts.
– Customizing visualizations for interactive reports and dashboards.
– Using slicers, filters, and advanced formatting techniques.
– Creating reports with multiple pages and interactive features.
➔ Module 4: Power BI Service and Sharing
– Publishing reports and dashboards to Power BI Service.
– Sharing and collaborating on Power BI reports with stakeholders.
– Setting up scheduled data refresh and report distribution.
– Creating workspaces and managing security permissions in Power BI Service.
➔ Module 5: Advanced Power BI Features and Case Studies
– Integrating Power BI with Excel and other data sources.
– Using Power BI API for custom automation and embedding reports in applications.
– Advanced visualizations using custom visuals in Power BI.
– Hands-on project and case studies to build a complete Power BI solution.
Tableau
➔ Tableau
➔ Module 1: Introduction to Tableau and Data Visualization Basics
– Overview of Tableau, Tableau Desktop, and Tableau Server.
– Understanding the importance of data visualization in business analytics.
– Connecting to data sources like Excel, CSV, and databases.
– Creating basic visualizations such as bar charts, line graphs, and scatter plots.
➔ Module 2: Intermediate Data Visualization Techniques
– Introduction to advanced chart types: Heatmaps, box plots, and treemaps.
– Customizing visualizations with colors, labels, and annotations.
– Understanding data blending and joins to combine multiple data sources.
– Creating interactive dashboards using actions, filters, and design best practices.
➔ Module 3: Advanced Analytics with Tableau
– Working with calculated fields and parameters, including advanced calculations (IF statements, LOD expressions).
– Implementing forecasting models and analyzing trends in data.
– Visualizing spatial data through geographic mapping and customizing maps.
– Exploring advanced analytics such as seasonality and identifying trends in Tableau.
➔ Module 4: Data Storytelling and Presentation Techniques
– Understanding the principles of data storytelling and structuring your narrative.
– Incorporating storytelling into data visualization with story points and annotations.
– Effective communication techniques for presenting insights to non-technical stakeholders.
– Presenting data findings confidently and clearly using Tableau’s visualization features.
➔ Module 5: Tableau Server and Collaboration
– Introduction to Tableau Server and its components.
– Publishing and sharing Tableau workbooks on Tableau Server.
– Managing users and permissions, setting access controls for data security.
– Collaboration features such as comments, subscriptions, and alerts for effective teamwork.


Career Track
Once you have enrolled for the program then you will have access to a wide range of resources which will help you in becoming a Job-Ready Candidate. We have a dedicated placement team of professionals who excel in their individual domains committed to assist you in our journey.
- 1 Months
Profile and Resume building
- Profile and Resume building
- Portfolio Building
- Build highly optimized
- Resumes and Cover Letters
- Build your LinkedIn Profile
Business Communication
- Master class from the industry expert
- Get proficient in business presentations
- Learn how to frame professional emails
- Excel in telephonic communication and Business Vocab
- Networking and building Interpersonal Skills
Competency Challenge Test
- Based on the course curriculum
- Evaluates the understanding of theoretical and practical concepts
- Adds credibility and accountability to the candidate
- Difficulty level – moderate
Technical Mock Interviews
- Interview prep and mock interviews
- Interview Best Practices
- Mock interviews
- Module-wise Interview Questions

Get Placed
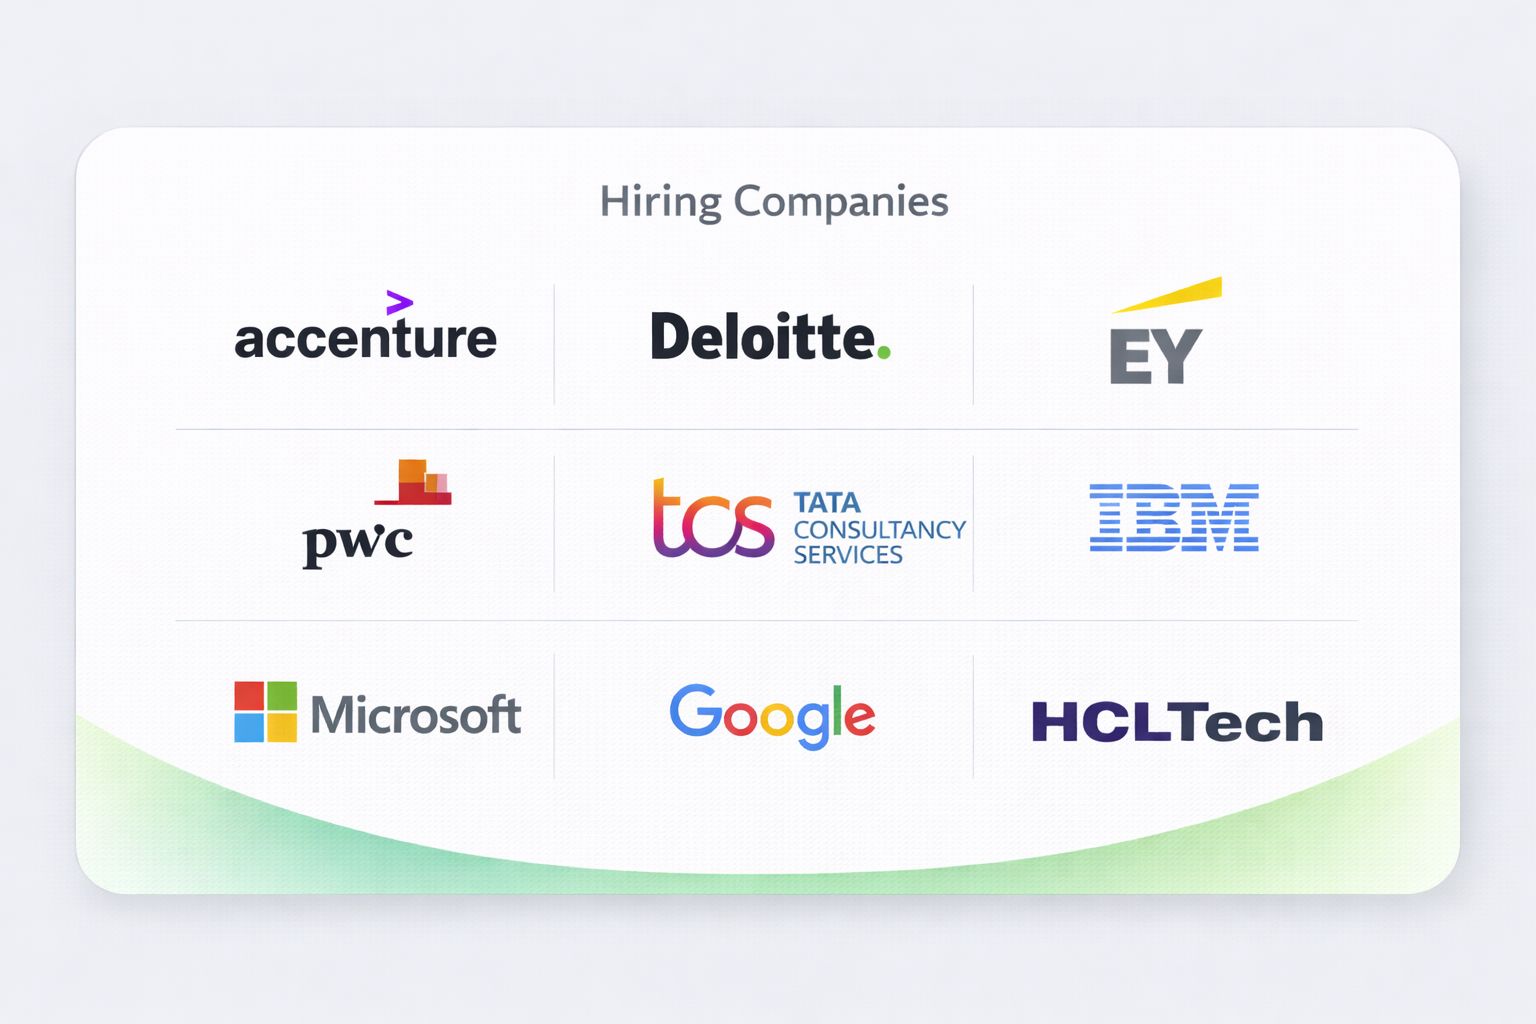
Companies Hiring for Business Analyst


95%
Placements
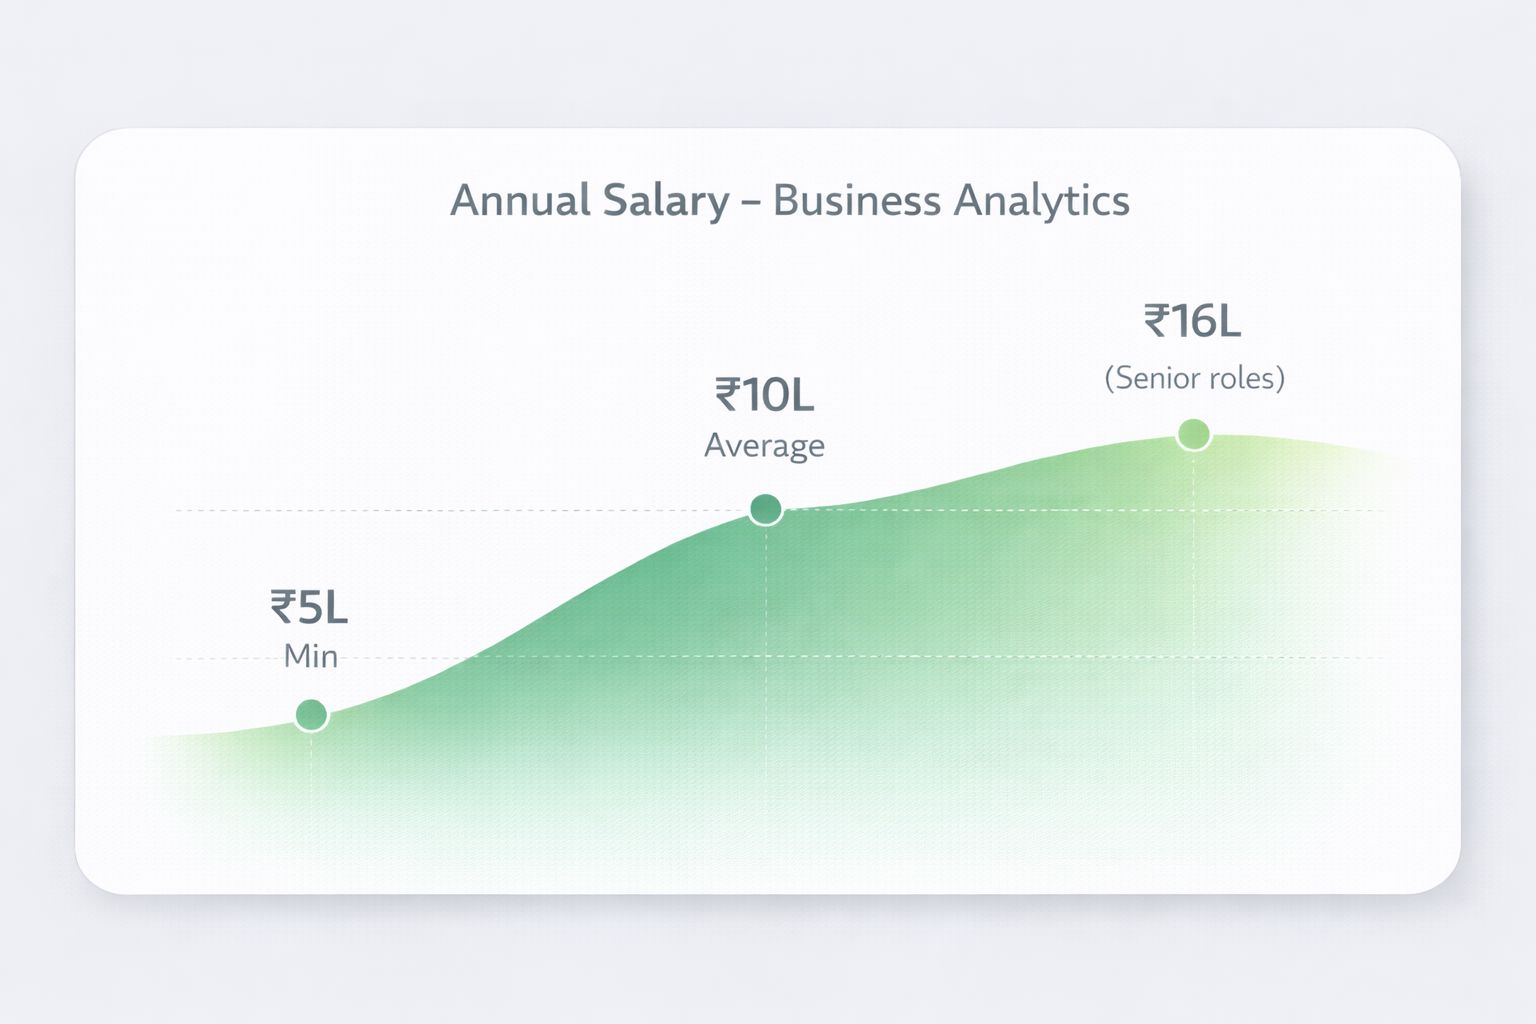
5 LPA
Average CTC
22 LPA
300+
82%
4.8/5
250+ Reviews
Online Business Analytics Course Training
- Ongoing Batch
Jan 17 - Mar 17 2026
IST: 09:00 AM – 01:00 PM
- Weekend Batch | 120 Sessions
- Certified Traine
- Next Batch
May 02 - July 02 2026
IST: 09:00 AM – 01:00 PM
- Weekend Batch | 120 Sessions
- Certified Traine
Do you want to customize your batch request?
Corporate Training
The work force is your asset. Up-Skill them with our Corporate Training Programs!
- Unleash In-Demand Skills Across the Enterprise
- Align Skill Development with Business Objectives
- Drive Increased Employee Productivity
- Leverage Immersive Learning
Online Business Analytics Certification Course Overview
How Business Analytics Certification Impacts Your Career
A Business Analytics Certification from Arivu Skills opens strong career opportunities in today’s data-driven business environment:
Career Advancement:
- Salary Growth: Certified Business Analytics professionals typically earn higher salaries compared to non-certified professionals, improving long-term earning potential.
- Job Security:Business Analytics roles are growing rapidly across IT, Finance, Healthcare, E-commerce, Manufacturing, and Consulting sectors as companies depend on data-driven decision-making.
What’s Included in the Course?
The Business Analytics Certification Program by Arivu Skills provides comprehensive, job-oriented training within 2 months:
Advanced Excel & Excel Analytics
Formulas, Pivot Tables, Dashboards, Power Query, Data Cleaning, MIS Reporting.Power BI
Data modeling, DAX basics, interactive dashboards, business reportingTableau
Data visualization, dashboard creation, storytelling with dataPractice Resources
Real-time projects, business case studies, assignments, and assessments- Expert Support
Dedicated doubt-clearing sessions and practical guidance throughout the course
Key Benefits:
- Flexible online format suitable for working professionals
- Placement assistance with profile building and resume optimization
- Interview preparation through mock sessions
- 9 Months access to course materials & Sessions
Business Analytics Eligibility and Prerequisites
Educational Qualifications:
Any Undergraduate or Postgraduate Degree
Open to fresh graduates and working professionals
No mandatory technical background required
Enrolling in the business analytics course with placement in Bangalore opens doors for professionals from diverse educational backgrounds seeking. To understand whether you qualify, review the business analytics – eligibility criteria and begin your career transformation through structured learning.
Basic Requirements :
- Laptop/PC with stable internet
Commitment of 8–10 hours per week for learning
The Business Analytics Certification from Arivu Skills ensures you gain practical, job-ready skills aligned with current industry demands, helping you build a structured and sustainable analytics career path.
Onine Business Analytics Course Certificate
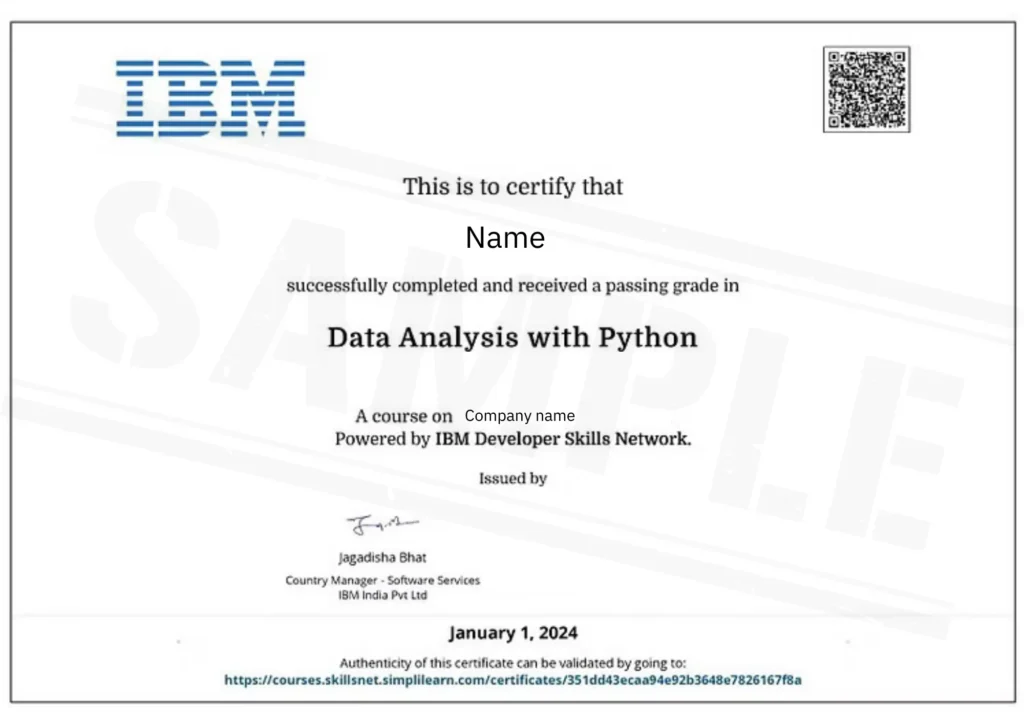
Skills Covered
- Advanced Excel
- Power BI
- Tableau
Tools Covered


Online Business Analytics Certification Course FAQ's
1. What is an Online Business Analytics Certification Course?
It is a program that teaches you how to analyze business data, generate insights, and support decision-making using tools and analytical techniques—delivered entirely online.
2. Who should enroll in this course?
This course is ideal for students, graduates, working professionals, and entrepreneurs who want to build or transition into a business analytics career.
3. Do I need prior experience in analytics or coding?
No, prior experience is not required. The course typically starts from basics and gradually covers advanced concepts.
4. What tools and skills will I learn?
You will learn tools like Excel, SQL, Power BI, Tableau, and basic statistics, along with business problem-solving and data visualization skills.
5. Is the course self-paced or instructor-led?
Most online courses offer a mix of self-paced learning and optional live sessions or mentorship support.
6. Will I work on real-world projects?
Yes, you will gain hands-on experience by working on industry-relevant projects and case studies.
7. How long does it take to complete the course?
The course duration typically ranges from 3 to 6 months, depending on your schedule and learning pace.
8. Will I receive a certification after completion?
Yes, you will receive a certification upon successfully completing the course, which can enhance your resume.
9. Do you provide placement assistance?
Yes, most programs offer placement support, including resume building, mock interviews, and job referrals.
10. Can I take this course while working full-time?
Absolutely. The flexibility of online learning allows you to study at your convenience alongside your job.
Distinctions and Achievements
Explore the milestones of our journey!

Best Skill Learning Institute of the Year
The Education Excellence Award by Brands Impact
Edutech Company of the Year
The Education Awards by The Corporate Titan

Institute with the Best Placement
The Education Awards by Mantra
People also viewed courses like
Business Analytics Course in Other Cities
Bangalore (Offline + Live- Online Class)
Chennai (Live - Online Class)
Coimbatore (Live - Online Class)
This course has served
3+
In-Demand Tools
2 Months
Structured Program
100%
Hands-On Training
IBM
Certification Included
Projects
Real-Time Capstone