
Key Takeaways
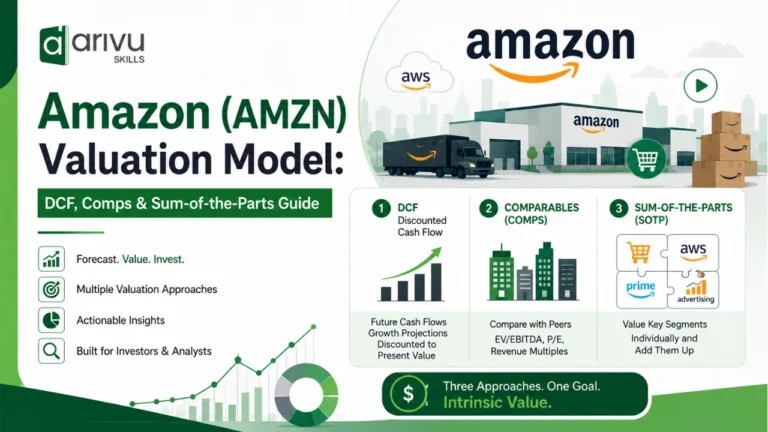
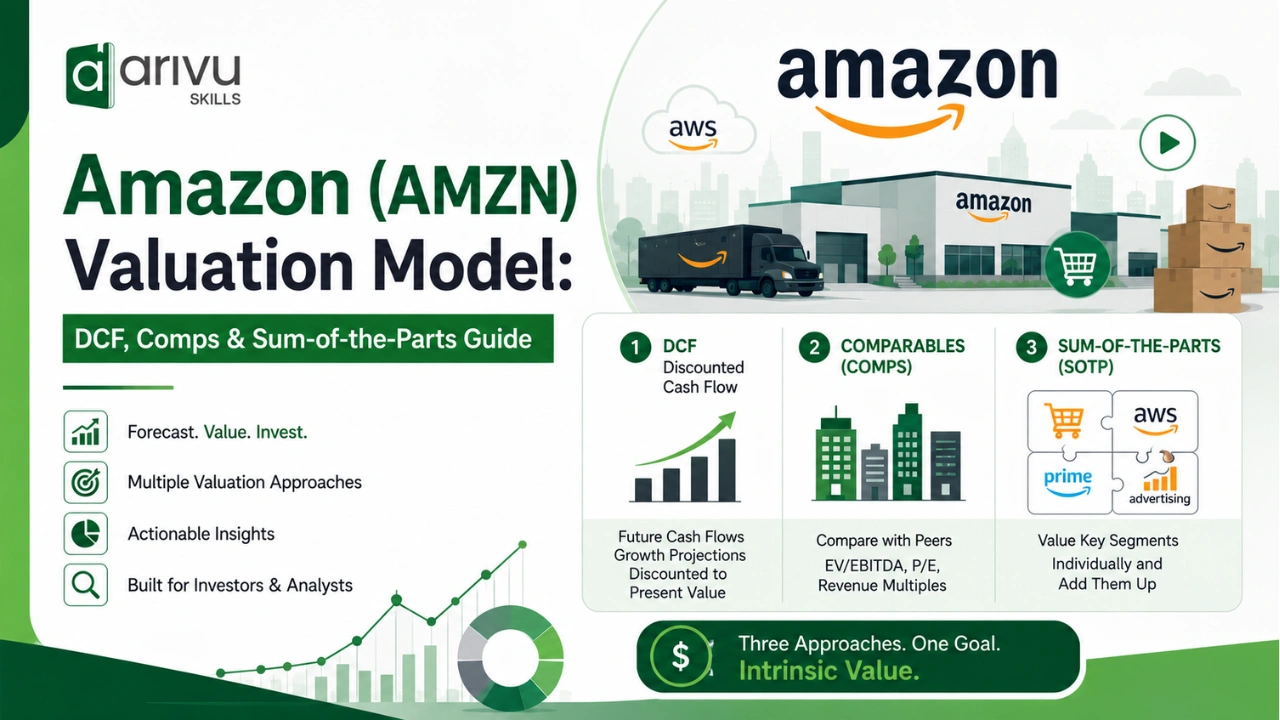
- Value Amazon with a combination of DCF, relative valuation, and sum-of-the-parts. Any single method on its own will mislead you in one direction or another.
- Published single-method DCF fair values for AMZN span roughly $228 to $309 per share, which says more about assumptions than about the model itself.
- AWS (37% growth, ~39% operating margin) and advertising (26% growth) are the highest-value segments, and blended, single-multiple valuations routinely under-credit both.
- Amazon’s forward P/E (~31x) sitting above its trailing P/E (~22x) signals the market is pricing in future earnings growth, not just rewarding current profitability.
- Strip out non-recurring items, like the $53.4 billion Anthropic-related gain in Q2 2026, before trusting a trailing P/E or EPS-based valuation.
Amazon trades on one ticker, but it’s really four businesses stitched together, and that’s what makes valuing it genuinely tricky. Below is a working framework built from Q2 2026 earnings data: a DCF, a comps table, and a sum-of-the-parts model, plus the places where published valuations disagree and why.
AMZN At A Glance (Early August 2026)
| Metric | Value |
|---|---|
| Stock price | ~$275 to $285 |
| Market capitalization | ~$3.0 trillion |
| Enterprise value | ~$3.1 to $3.2 trillion |
| Shares outstanding | 10.79 billion |
| Trailing P/E | ~21.5x to 22.8x |
| Forward P/E | ~30x to 31x |
| PEG ratio | 1.53 |
| Return on equity (ROE) | 30.56% |
| Return on invested capital (ROIC) | 11.94% |
| Beta | 1.45 |
| Q2 2026 revenue | $200.6B, up 20% year-over-year |
| Q2 2026 operating income | $27.5B, up 43% year-over-year |
| AWS revenue (Q2 2026) | $42.2B, up 37% year-over-year |
| Advertising revenue (Q2 2026) | $19.8B, up 26% year-over-year |
| TTM free cash flow | an outflow of $7.6B, driven by AI capex |
| 2026 capex guidance | ~$220 billion |
Why Amazon Can’t Be Valued With A Single Multiple
Amazon isn’t one business. It’s four, operating under one ticker, and each has a different margin profile, growth rate, and multiple that actually fits it:
- North America retail: high revenue, thin margins (7.9% operating margin in Q2 2026), and a capital-heavy logistics network.
- International retail: the same basic model as North America, just earlier on the path to profitability (4.1% operating margin).
- AWS: cloud infrastructure with software-like margins and the fastest growth of the three, 37% year-over-year in Q2 2026, the fastest pace in 18 quarters.
- Advertising: a high-margin, asset-light business built on top of existing retail and Prime Video traffic, growing 26% year-over-year.
Run a single blended P/E or EV/EBITDA multiple across all four and you’ll flatten these differences: AWS and advertising get undervalued, and the thin-margin retail business gets credit it hasn’t earned. That’s the case for using more than one valuation method, and it’s exactly where most AMZN valuation calculators fall short.
Method 1: Discounted Cash Flow (DCF)
The DCF model says a company’s value equals the present value of every dollar of free cash flow (FCF) it will generate in the future, discounted back to today using a rate that reflects risk, the weighted average cost of capital (WACC).
Enterprise value = Σ [FCFt / (1 + WACC)t] + terminal value / (1 + WACC)n
The Six Steps
- Project free cash flow over an explicit window, typically 5 to 10 years, starting from Amazon’s current revenue base and segment growth rates.
- Model margin expansion. AWS and advertising both run at structurally higher margins than retail, so as the revenue mix shifts toward them, consolidated FCF margin should climb over time.
- Account for capital intensity. Amazon’s 2026 capex guidance is roughly $220 billion, mostly AI data centers, and it’s the single biggest swing factor in near-term FCF. It’s also why trailing-twelve-month FCF turned negative (an outflow of $7.6 billion) even while operating income grew 43%.
- Calculate WACC. Using Amazon’s beta of 1.45, current risk-free rates, and its capital structure typically lands in the high single digits to low double digits.
- Estimate terminal value, usually with the Gordon Growth method (a 2% to 3% perpetual growth rate) or an exit-multiple approach.
- Discount everything back to present value, subtract net debt, and divide by diluted shares outstanding (10.79 billion) to land on a per-share fair value.
Why Published DCF Values For AMZN Disagree So Much
Run the same basic framework on two different sites and you’ll get very different answers. That gap is actually useful information:
| Source | DCF fair value | Implied signal |
|---|---|---|
| valueinvesting.io (5-year growth-exit model) | ~$308.62 | ~14% undervalued vs. then-current price |
| Alpha Spread (base case) | ~$227.96 | ~20% overvalued vs. then-current price |
The difference comes down to three assumptions: how aggressively AWS growth and margins get extrapolated, what terminal growth rate and WACC get used, and whether AI-related capex is treated as a temporary investment phase or a permanent drag on cash flow. Before trusting any AMZN DCF output, check those three inputs first. They explain almost all of the spread between models.
Building a DCF from scratch, projecting FCF, calculating WACC, sensitizing terminal value, is exactly the kind of hands-on skill covered in ArivuSkills’ Financial Modelling Course, running in both Bangalore and Chennai. You’ll build models like this one on real companies, not templates.
Method 2: Relative Valuation (Comparable Companies)
Relative valuation prices Amazon against its peers using ratios like P/E, EV/EBITDA, and PEG. It’s faster than a DCF and it grounds the valuation in what the market is actually paying for similar businesses right now.
| Company | Trailing P/E | Forward P/E | PEG | ROE | Beta |
|---|---|---|---|---|---|
| Amazon (AMZN) | ~22x | ~31x | 1.53 | 30.6% | 1.45 |
| Microsoft (MSFT) | ~25.1x | ~23.1x | 1.37 | 34.0% | 1.13 |
| Alphabet (GOOGL) | ~31.4x | ~29x | n/a | — | — |
| Walmart (WMT) | EV/EBITDA ~20.7x | — | — | — | — |
The most telling number in that table is the shape of Amazon’s own multiple. Its forward P/E (~31x) sits well above its trailing P/E (~22x), which is the opposite pattern from Microsoft, where the forward multiple is lower than the trailing one. That tells you the market is pricing in a step-change in earnings, mostly from AWS margin expansion and advertising scale, rather than valuing Amazon on what it has already booked. On paper Amazon’s P/E looks moderate. In practice, its comps read closer to a growth stock than the headline number suggests.
Method 3: Sum-Of-The-Parts (SOTP)
SOTP is the method most retail-facing valuation calculators skip, and for a company as segmented as Amazon, it’s arguably the one that matters most. Instead of applying one multiple to the whole company, you value each piece on its own terms and add them up:
- AWS, valued on an EV/EBITDA or EV/Revenue basis in line with cloud infrastructure peers, given its software-like operating margin (AWS posted $16.6B of operating income on $42.2B of revenue in Q2 2026, a margin near 39%).
- Advertising, valued closer to ad-tech and digital-media peers given its asset-light economics and 26% growth rate.
- North America and International retail, valued on a lower multiple in line with large-cap retailers such as Walmart, given thinner margins and a heavier capital base.
Add up the implied enterprise value of each piece and subtract net debt, and you typically get a different, often higher, equity value than a single blended multiple applied to consolidated earnings. AWS and advertising stop getting dragged down to retail’s lower multiple, which is where they end up in most simplified models.
Sum-of-the-parts is a step most self-taught analysts never learn properly. Arivu Skills’ Financial Modelling Course in Bangalore and Chennai teaches SOTP, DCF, and comps as one integrated framework, so you leave able to build a full valuation instead of just plugging numbers into a template.
The Real Drivers Behind Amazon’s Valuation
- AWS re-acceleration: 37% year-over-year growth in Q2 2026, the fastest in 18 quarters, on a $169 billion annualized revenue run rate with a growing backlog.
- Advertising scale: $19.8B in quarterly revenue, up 26% year-over-year, with AI-driven ad tools improving advertiser performance.
- Margin trajectory: North America operating margin at 7.9% and International at 4.1%, both expanding year-over-year.
- The AI capex supercycle: 2026 capex guidance of roughly $220 billion is funding the data-center buildout behind AWS growth, but it’s also why trailing FCF is negative despite record operating income. That tension between long-term growth investment and near-term cash generation is the central debate in any AMZN valuation right now.
- The Anthropic stake: Q2 2026 net income included a $53.4 billion non-operating pre-tax gain tied to Amazon’s investment in Anthropic. It’s a real gain, but it’s not recurring, and it pushed GAAP EPS ($5.75) well above core operating earnings. Any model built on trailing EPS should strip this out, or it will overstate what the trailing P/E is actually telling you.
Explore batch dates and enroll in the Financial Modelling Course in Chennai.
Bull Case Vs. Bear Case
| Bull case | Bear case |
|---|---|
| AWS growth reaccelerating for a fifth straight quarter, outpacing Azure’s roughly 43% and trailing only Google Cloud’s roughly 82% off a smaller base | AI capex ($220B guided for 2026) is outrunning free cash flow, which has gone negative on a trailing basis |
| Advertising is a high-margin, fast-growing profit engine layered on existing traffic | Forward P/E (~31x) sitting well above trailing P/E (~22x) means the market has already priced in a lot of future growth |
| Operating margins are expanding across all three core segments at the same time | Management has flagged rising memory-chip and transportation costs as a near-term margin pressure |
| Strategic AI stakes such as Anthropic add optionality beyond the core retail, cloud, and ads business | One-off investment gains can distort GAAP earnings and mislead a simple P/E-based valuation |
Risks To Any Amazon Valuation Model
- Assumption sensitivity: as the DCF comparison above shows, small changes to WACC or terminal growth swing fair value by tens of dollars per share.
- Treating one-off gains as recurring: investment-related gains, like the Anthropic stake, can distort trailing P/E and EPS-based models if you don’t adjust them out.
- Capex-cycle timing: if AI infrastructure spend doesn’t convert into AWS revenue and margin on the timeline the market expects, the current forward-multiple premium could compress.
- Rate sensitivity: with a beta of 1.45, AMZN’s valuation is more sensitive than the market average to shifts in interest rates and risk appetite.
- Currency and macro exposure: International segment results move with foreign-exchange swings that have nothing to do with underlying demand.
FAQs
No single model is the best on its own. A DCF captures Amazon’s long-term cash-generation potential, relative valuation shows what the market is paying for similar businesses today, and a sum-of-the-parts model corrects for the fact that AWS, advertising, and retail deserve very different multiples. Used together, they give a far more reliable range than any one method alone.
It depends on the model and the assumptions behind it. Published DCF estimates for AMZN range from roughly $228 to $309 per share against a market price near $275 to $285, spanning both overvalued and undervalued conclusions. The honest answer is that Amazon sits in a wide fair-value range, and where you land depends on how much credit you give AWS’s accelerating growth versus how much you discount for heavy AI capex.
There’s no single agreed-upon number. Different DCF models put fair value anywhere from about $228 to $309 per share, depending on WACC, terminal growth rate, and how AI capex is treated. A sum-of-the-parts model, which values AWS and advertising higher than retail, often lands on a different figure again.
Most models put Amazon’s WACC in the high single digits to low double digits, reflecting its beta of about 1.45, current risk-free rates, and its capital structure. DCF output is highly sensitive to this input, so it’s worth running the model at two or three different WACC assumptions and looking at the resulting range instead of anchoring to one fixed number.
The spread comes down to three inputs: how aggressively AWS growth and margin expansion get projected, the WACC and terminal growth rate chosen, and whether AI-related capital expenditure is modeled as a temporary investment phase or a lasting drag on cash flow. Two analysts using the same DCF framework can land tens of dollars per share apart just by changing these assumptions.
AWS is Amazon’s highest-margin segment, generating $16.6 billion of operating income on $42.2 billion of revenue in Q2 2026, a margin near 39%, well above North America’s 7.9% and International’s 4.1%. Because of that, AWS typically accounts for a disproportionate share of Amazon’s total valuation in a sum-of-the-parts model, even though it’s smaller than the retail segments by revenue.
Only partly. Amazon’s trailing P/E (~22x) is distorted by a one-off $53.4 billion non-operating gain tied to its Anthropic investment in Q2 2026, which inflated GAAP net income and EPS. Its forward P/E (~31x), higher than the trailing figure, is a better signal of what the market expects from core operating earnings growth, but any P/E-based valuation should adjust for non-recurring items first.
In Q2 2026 (ended June 30, 2026), Amazon reported revenue of $200.6 billion, up 20% year-over-year, and operating income of $27.5 billion, up 43%. AWS revenue grew 37% to $42.2 billion, its fastest growth in 18 quarters, while advertising revenue grew 26% to $19.8 billion. Net income came in at $62.6 billion, boosted by a $53.4 billion non-operating gain from Amazon’s Anthropic investment.