
A company can report a healthy profit and still struggle to pay suppliers, fund expansion or meet debt obligations. This happens because the income statement shows profitability, while the balance sheet reveals where the money is tied up and how the business is financed.
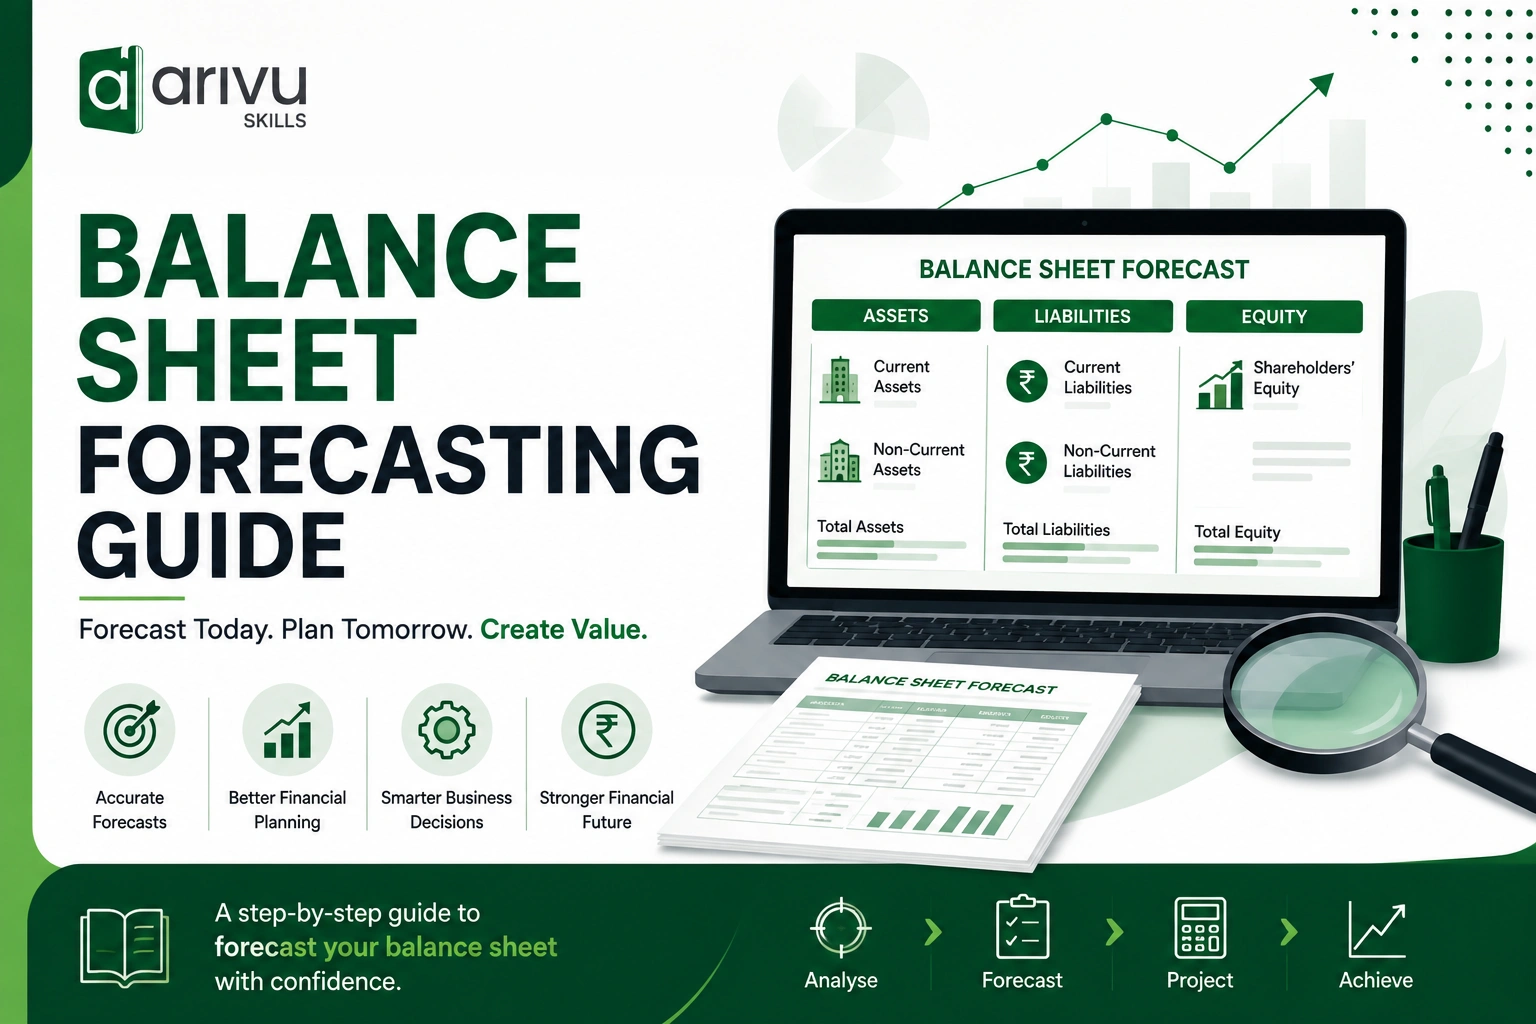
Balance sheet forecasting estimates a company’s future assets, liabilities and shareholders’ equity. It is an essential part of financial modelling because it connects operating assumptions with cash flow, borrowing requirements and business valuation.
This guide explains how to forecast each major balance sheet item, connect the statements and check whether the completed model works correctly.
Want to practise these below concepts with Excel-based assignments and real company case studies? Explore the Financial Modelling Course in Chennai by Arivu Skills and learn financial statement modelling, forecasting and valuation through hands-on training.
What Is Balance Sheet Forecasting?
Balance sheet forecasting is the process of estimating what a company’s financial position may look like at a future date. The forecast usually includes:
- Current and non-current assets
- Current and non-current liabilities
- Shareholders’ equity
- Supporting schedules for working capital, fixed assets and debt
A projected balance sheet is normally built as part of a three-statement financial model. In this model, the income statement, balance sheet and cash flow statement are dynamically connected.
The balance sheet must always follow the accounting equation:
Assets = Liabilities + Shareholders’ Equity
If the two sides do not match, the model contains an error or an incomplete link.
Why Is Balance Sheet Forecasting Important In Financial Modelling?
Forecasting the income statement alone does not provide a complete picture of a business. Revenue growth may require higher inventory, additional equipment, more customer credit or external funding.
A balance sheet forecast helps analysts answer practical questions such as:
- How much working capital will the company require?
- Will the business generate enough cash to repay debt?
- Does the company need additional borrowing?
- How will capital expenditure affect fixed assets?
- Can the company maintain sufficient liquidity?
- How will retained earnings change over time?
It also helps management test business plans before committing money. For example, if sales are expected to grow by 25%, the model can estimate the extra inventory and receivables needed to support that growth.
How Does A Forecast Balance Sheet Connect With Other Financial Statements?
Balance sheet forecasting should not be completed independently. Every major line item connects to the income statement, cash flow statement or a supporting schedule.
| Balance Sheet Item | Main Forecast Driver | Related Statement Or Schedule |
| Accounts receivable | Revenue and collection period | Income statement |
| Inventory | Cost of goods sold and inventory days | Income statement |
| Accounts payable | Cost of goods sold and payment period | Income statement |
| PP&E | Capital expenditure and depreciation | Fixed asset schedule |
| Debt | Borrowing and repayments | Debt schedule |
| Retained earnings | Profit and dividends | Income statement |
| Cash | Net movement in cash | Cash flow statement |
According to the Corporate Finance Institute, a three-statement model links the income statement, balance sheet and cash flow statement into one connected financial model. Changes in assumptions should flow through all three statements automatically.
What Information Is Needed Before Building The Forecast?
Start with clean historical data. Most financial models use at least three years of past financial statements, although the period may vary depending on data availability and the nature of the business.
Collect the following information:
- Historical balance sheets
- Income statements
- Cash flow statements
- Revenue and cost forecasts
- Capital expenditure plans
- Debt terms and repayment schedules
- Dividend policy
- Tax assumptions
- Management guidance
- Industry or operational data
Historical numbers should use consistent accounting classifications. If trade receivables were grouped with other current assets in one year but reported separately in another, adjust the historical statements before calculating forecast ratios.
How To Forecast A Balance Sheet Step By Step
Step 1: Enter And Review Historical Data
Place the historical balance sheets in chronological order. Calculate relevant ratios and operating metrics for each year.
Common historical metrics include:
- Receivable days
- Inventory days
- Payable days
- Capital expenditure as a percentage of revenue
- Depreciation as a percentage of opening PP&E
- Other current assets as a percentage of revenue
- Accrued expenses as a percentage of operating expenses
Do not apply a historical average without understanding what caused the movement. A major customer delay, supply-chain disruption or one-time capital purchase can distort the average.
Step 2: Forecast Accounts Receivable
Accounts receivable represents money owed by customers for credit sales. It is generally forecast using days sales outstanding, also called receivable days.
Receivable Days = Average Accounts Receivable ÷ Revenue × 365
The forecast formula is:
Forecast Accounts Receivable = Revenue × Receivable Days ÷ 365
Suppose forecast revenue is ₹50 crore and the company normally collects payments in 45 days:
Accounts Receivable = ₹50 crore × 45 ÷ 365 = ₹6.16 crore
If the business expects faster collections, reduce the receivable-days assumption. If it plans to offer longer credit terms, increase it.
Use credit sales instead of total revenue when reliable credit-sales data is available.
Step 3: Forecast Inventory
Inventory is usually linked to the cost of goods sold rather than revenue.
Inventory Days = Average Inventory ÷ Cost of Goods Sold × 365
The forecast formula is:
Forecast Inventory = Cost of Goods Sold × Inventory Days ÷ 365
If forecast cost of goods sold is ₹30 crore and inventory days are expected to remain at 60:
Inventory = ₹30 crore × 60 ÷ 365 = ₹4.93 crore
Inventory assumptions should reflect production cycles, purchasing plans, seasonality and expected demand. A retailer may require a monthly or quarterly schedule because year-end figures can hide seasonal peaks.
Step 4: Forecast Accounts Payable
Accounts payable represents amounts owed to suppliers. It is commonly forecast using payable days.
Payable Days = Average Accounts Payable ÷ Cost Of Goods Sold × 365
The forecast formula is:
Forecast Accounts Payable = Cost Of Goods Sold × Payable Days ÷ 365
If forecast cost of goods sold is ₹30 crore and suppliers provide 40 days of credit:
Accounts Payable = ₹30 crore × 40 ÷ 365 = ₹3.29 crore
Purchases are a better driver than cost of goods sold when purchase data is available, particularly when inventory levels change significantly.
Step 5: Forecast Other Working Capital Items
Other current assets and liabilities may include:
- Prepaid expenses
- Employee advances
- Accrued expenses
- Taxes payable
- Deferred revenue
- Other receivables
- Other payables
Select a driver that matches the economic behaviour of each account.
For example:
- Prepaid expenses may be forecast as a percentage of operating expenses.
- Deferred revenue may be linked to subscription billings.
- Tax payable may be based on tax expense and payment timing.
- Accrued salaries may be linked to employee costs.
Avoid grouping unrelated accounts under a single revenue-based assumption simply because it is easier.
Step 6: Build The Fixed Asset Schedule
Property, plant and equipment should be forecast through a fixed asset schedule.
The basic formula is:
Closing PP&E = Opening PP&E + Capital Expenditure − Depreciation − Asset Disposals
Capital expenditure may be based on:
- Management’s expansion plans
- Planned asset purchases
- Capacity requirements
- A percentage of revenue
- Maintenance capital expenditure assumptions
Depreciation should flow from the fixed asset schedule to the income statement. Capital expenditure appears as an investing cash outflow in the cash flow statement.
Using a fixed asset schedule prevents depreciation, capital expenditure and asset balances from being forecast separately with conflicting assumptions.
Step 7: Forecast Intangible Assets
Intangible assets can include software, patents, licences and acquired customer relationships.
A simple intangible asset schedule follows this formula:
Closing Intangible Assets = Opening Balance + New Additions − Amortisation − Impairment
Amortisation flows to the income statement. New purchases are generally recorded under investing activities in the cash flow statement.
Goodwill is normally kept constant unless the forecast includes an acquisition or impairment assumption.
Step 8: Prepare The Debt Schedule
Debt should be forecast using a separate debt schedule rather than a fixed percentage of revenue.
The formula is:
Closing Debt = Opening Debt + New Borrowing − Principal Repayment
The schedule should distinguish between:
- Short-term borrowings
- Current portion of long-term debt
- Long-term loans
- Lease liabilities
- Revolving credit facilities
Interest expense is calculated using the debt balance and applicable interest rate. Because interest affects profit, profit affects retained earnings, and cash may affect borrowing, debt schedules can create circular references.
Beginners can avoid unnecessary circularity by calculating interest on average debt or using a simple opening-balance assumption.
Step 9: Forecast Shareholders’ Equity
Equity may include share capital, additional paid-in capital, retained earnings and other reserves.
Share capital generally remains unchanged unless the company expects a new share issue, employee stock transaction or buyback.
Retained earnings follow this formula:
Closing Retained Earnings = Opening Retained Earnings + Net Profit − Dividends
Net profit comes from the income statement. Dividends appear as a financing cash outflow.
This connection is important. If forecast profit does not update retained earnings, the balance sheet will not balance correctly.
Step 10: Calculate The Cash Balance
Cash is usually the final balance sheet item to be completed. It should come from the cash flow statement, not from an independent assumption.
Closing Cash = Opening Cash + Net Change In Cash
The net change includes cash generated or used in:
- Operating activities
- Investing activities
- Financing activities
Working capital affects operating cash flow. Capital expenditure affects investing cash flow. Borrowing, repayments and dividends affect financing cash flow.
If the calculated cash balance becomes negative, the model may need a revolving credit facility or another funding source. Do not simply replace negative cash with zero, as that hides the funding gap.
Step 11: Complete The Balance Check
After all line items are forecast, calculate:
Balance Check = Total Assets − Total Liabilities − Total Equity
A correct model should return zero.
If it does not, review:
- Retained earnings links
- Cash flow calculations
- Debt movements
- Capital expenditure
- Depreciation and amortisation
- Working capital changes
- Signs used in formulas
- Opening and closing balance references
Never use a plug value in equity or another account merely to force the balance sheet to balance. A balancing difference is a warning that something in the model needs attention.
Practical Balance Sheet Forecasting Example
Assume a company has the following forecast:
| Item | Assumption | Forecast Amount |
| Revenue | Management forecast | ₹50.00 crore |
| Cost of goods sold | 60% of revenue | ₹30.00 crore |
| Accounts receivable | 45 days of revenue | ₹6.16 crore |
| Inventory | 60 days of COGS | ₹4.93 crore |
| Accounts payable | 40 days of COGS | ₹3.29 crore |
| Capital expenditure | 8% of revenue | ₹4.00 crore |
| Depreciation | Fixed asset schedule | ₹1.50 crore |
The operating working capital requirement is:
Operating Working Capital = Accounts Receivable + Inventory − Accounts Payable
Operating Working Capital = ₹6.16 crore + ₹4.93 crore − ₹3.29 crore = ₹7.80 crore
If the previous year’s operating working capital was ₹6.50 crore, the increase is ₹1.30 crore. This increase is a use of cash in the cash flow statement.
This example shows why revenue growth does not automatically lead to an equal increase in cash. Part of the additional money may be locked in receivables and inventory.
Common Balance Sheet Forecasting Methods
Days-Based Forecasting
This method is commonly used for receivables, inventory and payables. It connects each account to its underlying operating cycle.
Percentage-Of-Revenue Method
Certain accounts can be forecast as a percentage of revenue when they move broadly with sales. Examples may include other receivables or selected operating assets.
Use this method only when historical data supports the relationship.
Direct Assumption Method
Some balances are better forecast using management plans or contractual information. These may include debt repayments, share issues, dividends and major capital investments.
Supporting Schedule Method
PP&E, debt, retained earnings and intangible assets should generally be calculated through supporting schedules. This makes the model easier to audit and update.
Common Mistakes To Avoid
Forecasting Every Item As A Percentage Of Revenue
Not every balance sheet account grows with sales. Debt depends on funding requirements, while PP&E depends on capital expenditure and depreciation.
Using Inconsistent Working Capital Formulas
Receivables should normally be linked to revenue, while inventory and payables are usually linked to cost of goods sold or purchases.
Hard-Coding Forecast Numbers
Hard-coded values make the model difficult to update. Place assumptions in clearly labelled cells and link the forecast formulas to them.
Ignoring The Cash Flow Statement
The balance sheet and cash flow statement must reconcile. Forecasting cash independently breaks the three-statement model.
Hiding A Negative Cash Balance
Negative cash indicates a funding requirement. The model should calculate the required borrowing instead of concealing the shortfall.
Copying Formulas Before Testing The First Forecast Period
Build and test the first forecast year carefully. Once it balances and the links work correctly, copy the formulas across the remaining forecast period.
Using A Balancing Plug Without Economic Logic
A plug should represent a real financial mechanism, such as a revolving credit facility. It should not be an unexplained number inserted into equity or liabilities.
Best Practices For Building A Reliable Forecast
- Keep historical data, assumptions and formulas visually separate.
- Use consistent sign conventions across all statements.
- Link related accounts instead of entering repeated assumptions.
- Add a visible balance check for every forecast period.
- Document the source and reasoning behind major assumptions.
- Use scenario analysis for base, upside and downside cases.
- Review ratios after completing the forecast.
- Test whether changing one assumption updates all three statements correctly.
The forecast should also pass a common-sense test. If revenue doubles but inventory, receivables and fixed assets remain unchanged, review the assumptions before trusting the result.
How Scenario Analysis Improves Balance Sheet Forecasting
A single forecast cannot capture every possible outcome. Scenario analysis helps assess how changes in business conditions affect liquidity and funding.
A financial model may include:
- A base case based on the most likely assumptions
- An upside case with stronger sales or margins
- A downside case with slower collections, lower revenue or higher costs
The downside case is particularly useful for testing whether the business can meet short-term liabilities and debt payments during a difficult period.
Sensitivity analysis can also show how specific variables, such as receivable days or capital expenditure, affect the closing cash balance.
FAQs
A forecast balance sheet estimates a company’s future assets, liabilities and shareholders’ equity based on historical performance and forward-looking assumptions.
It shows how business assumptions affect working capital, cash, debt, fixed assets and equity. It also connects the income statement with the cash flow statement in a three-statement model.
Operating working capital items such as accounts receivable, inventory and accounts payable are often forecast first. PP&E, debt, equity and cash are then completed using supporting schedules and statement links.
Accounts receivable is commonly calculated by multiplying forecast revenue by receivable days and dividing the result by 365.
Cash normally comes from the cash flow statement. If cash becomes negative, the model should identify a borrowing or funding requirement rather than force the amount to zero.
Common reasons include incorrect retained earnings, missing cash flow links, sign errors, incomplete debt movements and inconsistent capital expenditure or depreciation calculations.
A budget sets financial targets for a future period. A balance sheet forecast estimates the company’s expected financial position based on operating, investment and financing assumptions. The two may be connected within the same financial planning model.