Certificate in Data Analytics Using Python
Build a future-ready career in data analytics with our Certificate in Data Analytics Using Python, designed to provide you with practical, hands-on experience in Python programming, data analysis, and data visualization for solving real-world business problems.
This program equips learners with strong foundational knowledge in Python programming, data analysis, statistical techniques, and data visualization, enabling them to clean, transform, analyze, and interpret data, create meaningful visualizations, and derive actionable insights to support data-driven decision-making.
Talk to a Consultant
Fill in the details to get started
Learning Format
Online Bootcamp
Validity
6 Months
Access Anytime
Grant Thornton
About Program
The program by Arivu Skills, guided by experienced faculty and industry experts, is designed to build a strong foundation in Python-based data analytics. It equips learners with the skills needed to work with structured data using NumPy and Pandas, perform statistical and probability analysis, visualize data using industry-standard libraries, and apply analytical techniques such as hypothesis testing and regression analysis to solve real-world business problems.
Key Highlights
- Industry-aligned curriculum
- Real-world datasets & projects
- Python programming fundamentals
- Data analysis using NumPy & Pandas
- Data visualization techniques
- Statistics & probability in Python
- Dual certification
- Hypothesis testing & regression
- Practical, hands-on learning
- Job-ready skill focus

Are you Confused? Let us assist you.
Discover the Ultimate
Brochure Now
About Grant Thornton
ArivuSkills, in collaboration with Grant Thornton, brings a strong focus on application-oriented learning and industry-driven innovation across key domains such as strategy, analytics, risk, and digital transformation. Backed by Grant Thornton’s global expertise and real-world consulting experience, the program emphasizes practical problem-solving, business impact, and future-ready skills to help learners thrive in a rapidly evolving professional landscape.
Who Can Apply for the Course?
- Students from any degree background
- Engineering, science, commerce, or management students
- Fresh graduates aspiring for data analytics careers
- Working professionals looking to upskill
- Aspiring data analysts, business analysts, and Python developers
- Beginners with no prior experience
What roles can a Data Analytics Using Python professional play?
Data Analyst
Collect, clean, analyze, and interpret datasets using Python to uncover insights, identify trends, and support data-driven business decisions.
Data Visualization Analyst
Design interactive charts and visual reports using Python visualization libraries to communicate insights and support effective business storytelling.
Python Data Analyst
Develop Python-based data analysis solutions using libraries such as NumPy and Pandas to process, transform, and visualize structured data efficiently.
Junior Data Scientist
Apply statistical analysis, probability concepts, hypothesis testing, and regression techniques to solve business problems and build predictive analytical models.
Business Analyst
Analyze business data, identify growth opportunities, and create analytical reports that help organizations improve performance and strategic decision-making.
Analytics Consultant
Work with organizations to analyze business data, identify actionable insights, and recommend data-driven solutions that improve operational and business performance.
Skills to Master
Python Programming
NumPy
Pandas
Data Visualization
Statistical Analysis
Probability Concepts
Hypothesis Testing
Regression Analysis
Text Analytics
Data-Driven Decision Making
Tools to Master







Curriculum
- Live Course
- Self Paced
- Industry Expert
- Academic Faculty
Module 1: Introduction to Python Programming
Module 2: Fundamental concepts of Python
Module 3: Introduction to Numpy
Module 4: Data Analysis using Pandas
Module 5: Introduction to Text Analytics
Module 6: Data Visualization with Matplotlib and Seaborn
Module 7: Fundamentals of Statistics in Python
Module 8: Fundamentals of Probability in Python
Module 9: Hypothesis Testing in Python
Module 10: Regression Analysis
Program Highlights
- 36+ Hours of Comprehensive Data Analytics Using Python Learning
- Industry-Relevant Case Studies & Practical Applications
- Live Online Classes with Industry Experts
- 24*7 Support
Companies Hiring for Financial Modelling & Valuation Professional










Admission Details
The admission process is quick and simple. Fill out the admission form on this page, our Career Guidance team will call to confirm your enrollment, and you’ll get instant access to your course.

Fill the Form
Share your details in the admission form on this page to get started.

Confirmation Call
Our Career Guidance team will call to confirm your enrollment and answer any questions.

Get Course Access
Once confirmed, you'll get instant access and can start learning right away.
Frequently Asked Questions
1. What is Data Analytics Using Python, and why is it a valuable career skill?
Data Analytics Using Python involves collecting, analyzing, and visualizing data to uncover meaningful insights that support business decision-making. Python is one of the most widely used programming languages for data analytics, making it a valuable skill across industries.
2. Do I need prior programming experience to enroll in this course?
No. This course is designed for beginners, students, fresh graduates, and working professionals. It starts with Python fundamentals before progressing to data analysis, visualization, and statistical techniques.
3. What tools and techniques will I learn in this course?
You will gain hands-on experience with Python, NumPy, Pandas, Jupyter Notebook, Matplotlib, Seaborn, and AI-assisted productivity tools while learning data analysis, visualization, and statistical techniques.
4. What job roles can I apply for after completing this course?
Upon successful completion, you can pursue roles such as Data Analyst, Python Data Analyst, Business Analyst, Data Visualization Analyst, Junior Data Scientist, and Analytics Consultant.
5. What is the average salary for a Financial Modelling & Valuation professional in India?
Entry-level Data Analytics professionals typically earn between ₹4 LPA and ₹8 LPA, while experienced professionals with strong analytical and Python skills can earn significantly more depending on their role, industry, and experience.
6. Who should attend this course?
This course is ideal for students, fresh graduates, working professionals, aspiring data analysts, business analysts, Python enthusiasts, and anyone looking to build a career in data analytics.
7. What certification will I receive upon successful completion?
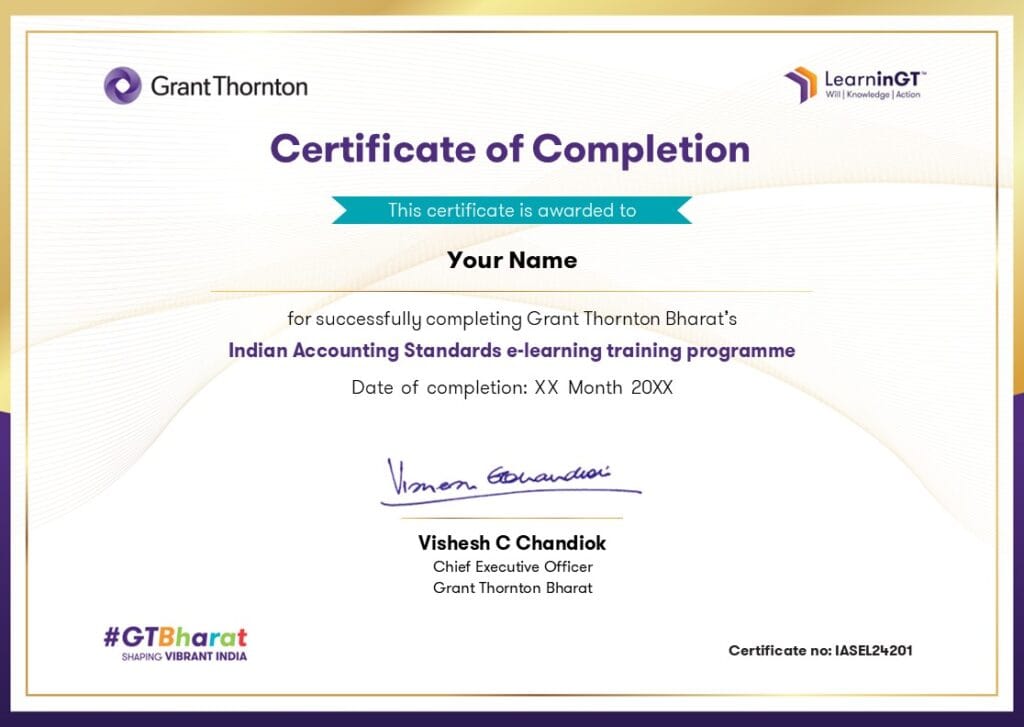
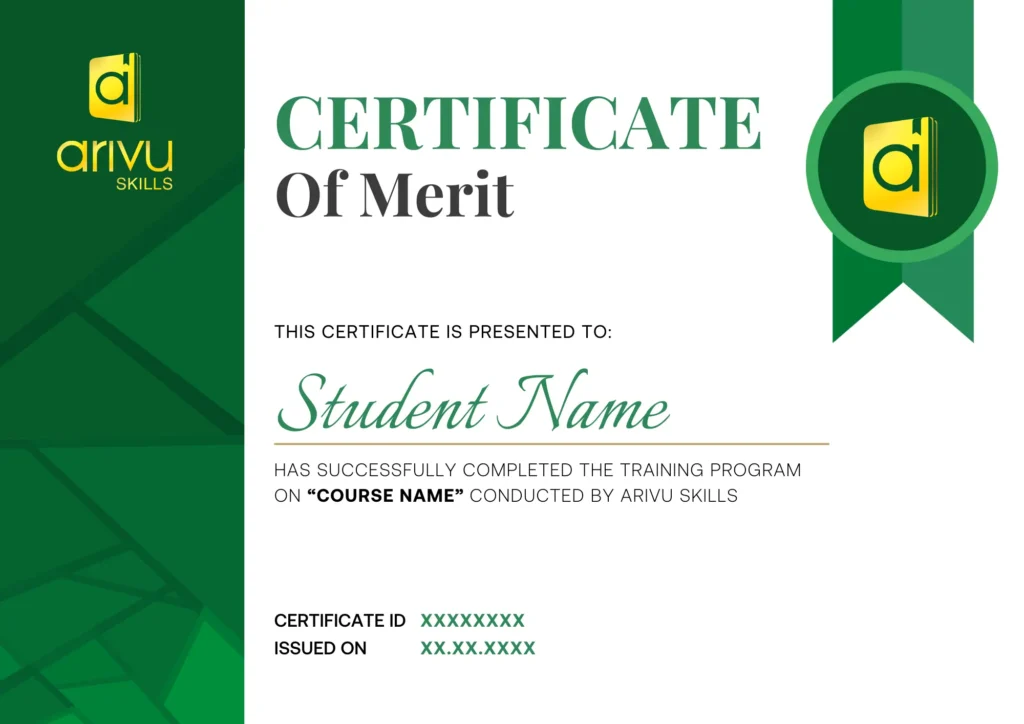
Upon successful completion of the program, learners will receive a Grant Thornton Certification along with an Arivu Skills Certificate, validating their knowledge of Python-based data analytics and industry-ready analytical skills.
8. Will I work on real-world datasets and practical projects?
Yes. The course includes hands-on exercises, practical assignments, and real-world datasets to help learners apply Python, data analysis, and visualization techniques to solve business problems.
9. What topics does the curriculum cover?
The curriculum covers Python programming fundamentals, NumPy, Pandas, text analytics, data visualization using Matplotlib and Seaborn, statistics, probability, hypothesis testing, and regression analysis.
10. Where is Arivu Skills located in Bangalore?
Arivu Skills is located at 1st Floor, Sai Prema, Christ Lane No. 39, Krishnanagar, Hosur Road, Koramangala, Bengaluru – 560029. The institute offers both classroom training and live online classes, making it accessible for students across Bangalore.